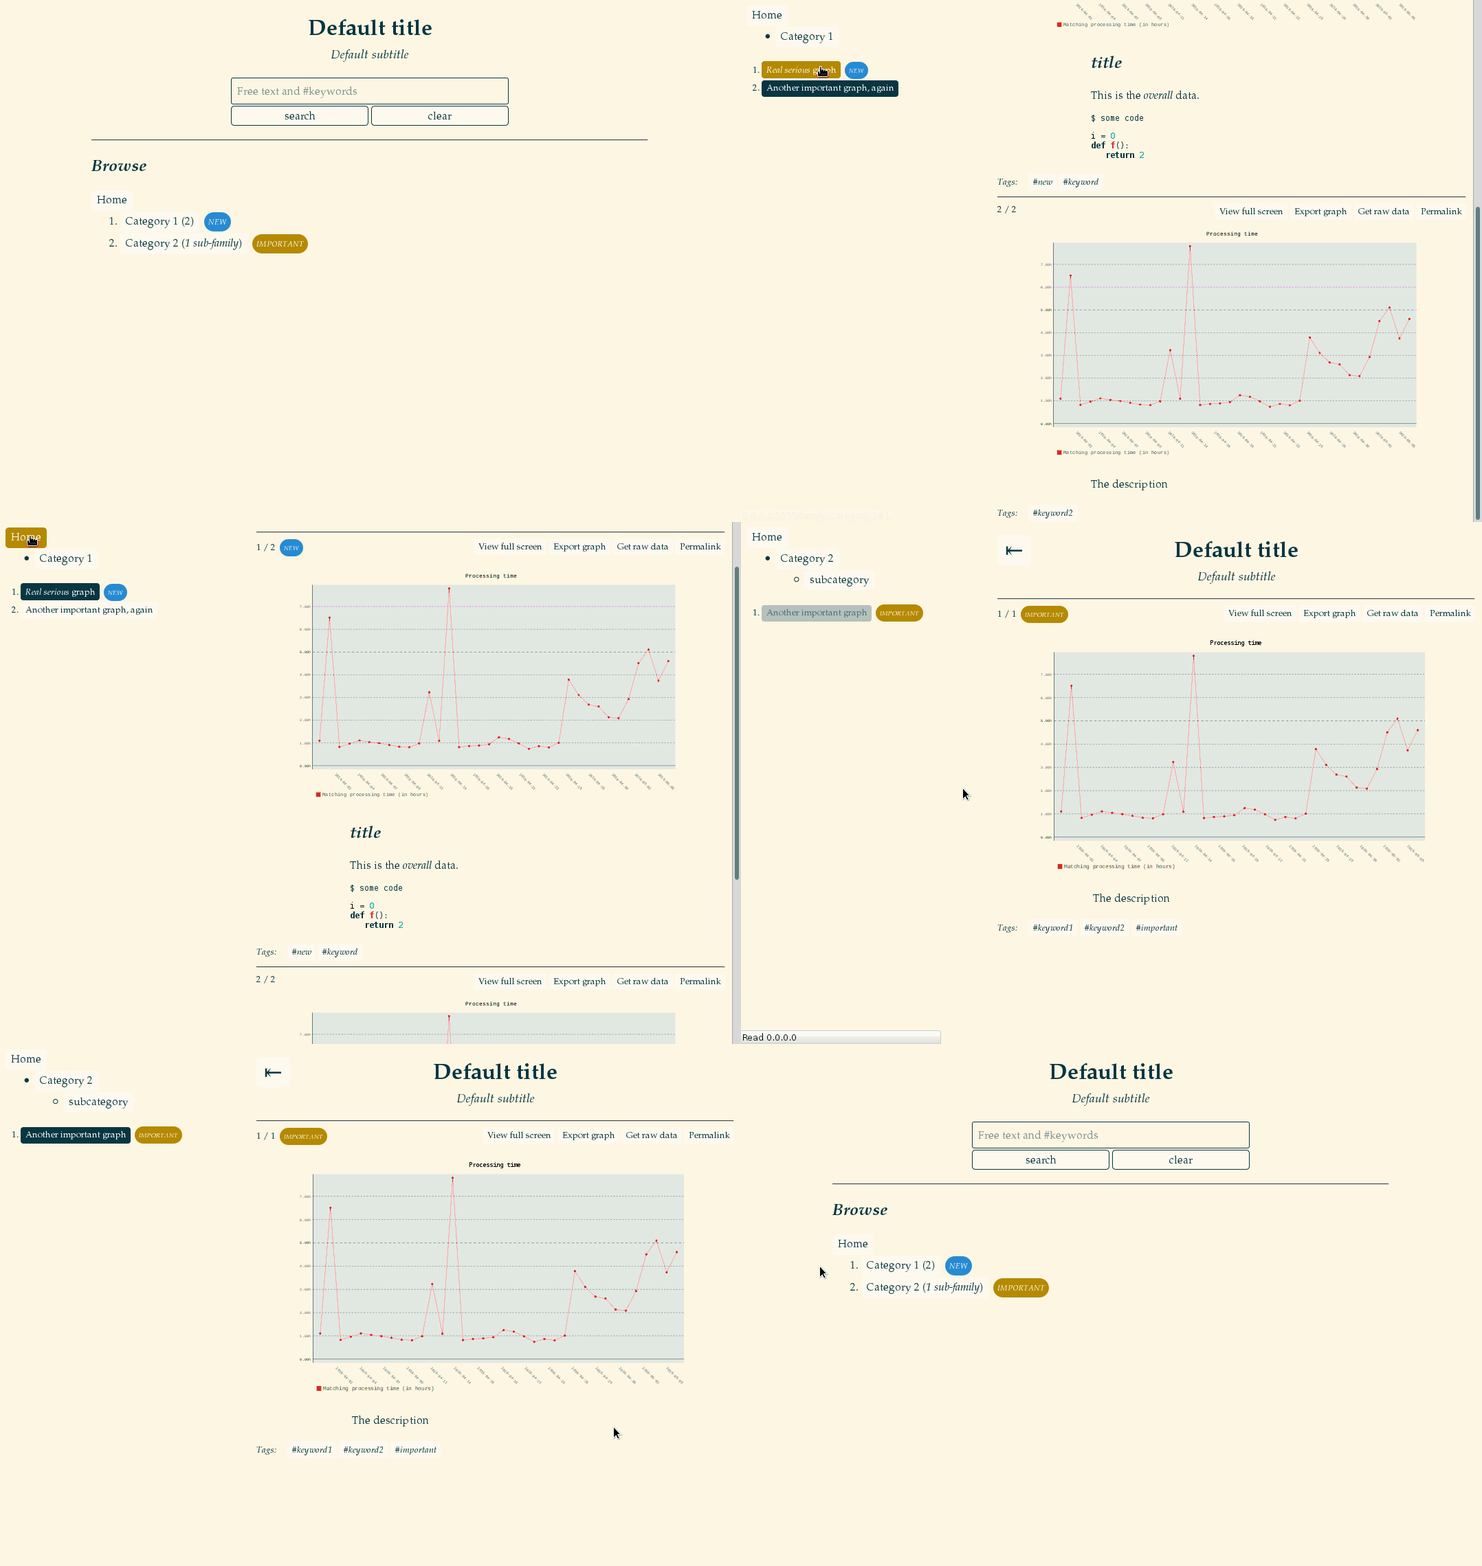
GraphDash is a web-based dashboard built on graphs and their
metadata. For example, if you have two graphs in a directory:
$ cd default_graph_dir
$ ls
graph.svg graph2.svg
Then you can create two metadata files using YAML format, where you can configure how the graphs will be displayed:
$ cat graph.yaml
name: graph.svg
family: 'Category 1'
title: '*Real serious* graph'
text: |
    The description

$ cat graph2.yaml
name: graph2.svg
family: 'Category 2'
title: 'Another important graph'
You may then start the graph dashboard. You will get a nice web interface displaying your graphs, and a search box with autocompletion. You can easily navigate and share your graphs.
$ GraphDash --root .
* Running on http://0.0.0.0:5555/ (Press CTRL+C to quit)Clone and install (in user space):
git clone https://github.com/AmadeusITGroup/graphdash.git
cd graphdash
pip install --user .
Or use the Python package:
pip install --user graphdashFor user-space installation, make sure your $PATH includes
~/.local/bin.
$ GraphDash -r default_graph_dir
* Running on http://0.0.0.0:5555/ (Press CTRL+C to quit)
The dashboard can be configured with a YAML config file and the
-c/--conf option:
$ cat docs/graphdash.yaml
root: ../default_graph_dir
title: "Example of title ;)"
subtitle: "Example of subtitle"

$ GraphDash -c docs/graphdash.yaml
* Running on http://0.0.0.0:5555/ (Press CTRL+C to quit)
You can generate a template of configuration file:
$ GraphDash -C template.yamlIf not already installed on your machine, install Gunicorn:
pip install --user gunicorn setproctitle # on Fedora you may need to install libffi-devel beforeSince you can import the webapp through graphdash:app, you can serve
it with Gunicorn:
gunicorn -b 0.0.0.0:8888 --pid server.pid graphdash:appThe configuration file of the webapp can be set with the CONF
environment variable. With Gunicorn, you can pass environment
variables to the workers with --env:
gunicorn -b 0.0.0.0:8888 --pid server.pid --env CONF=docs/graphdash.yaml graphdash:appBut you should not use these commands yourself, that is what
GraphDashManage is for!
GraphDashManage is used to start, stop, restart the
instances of Gunicorn serving graphdash:app. It needs a
configuration file in the current directory:
$ cat settings.sh
ALL_MODES=(
   ['prod']="docs/graphdash.yaml"
   ['test']="docs/graphdash.yaml"
)
ALL_PORTS=(
   ['prod']=1234
   ['test']=5678
)
WORKERS=3
Then you can manage multiple instances of GraphDash using
Gunicorn with:
$ GraphDashManage start prod
[INFO] Listening at: http://0.0.0.0:1234
[INFO] Booting worker with pid: 30403
[INFO] Booting worker with pid: 30404
[INFO] Booting worker with pid: 30405

$ GraphDashManage start test
[INFO] Listening at: http://0.0.0.0:5678
...
You can generate a template of settings:
$ GraphDashManage template > template.sh # to be moved to settings.shPossible entries (everything is optional):
root: the root directory of the graphsfamilies: path to the families metadata file (optional)title: the title of the webappsubtitle: the subtitle of the webappplaceholder: the default text in the search fieldheader: an optional message at the top (markdown syntax)footer: an optional message at the bottom (markdown syntax)showfamilynumbers: a boolean to toggle family numbering (default is true)showgraphnumbers: a boolean to toggle graph numbering (default is true)theme: change css theme (default is dark)keep: the proportion of common words kept for autocompletionlogfile: change default log file of the webappraw: when loading, look for all graphs and ignore metadataverbose: a boolean indicating verbosity when loading applicationdebug: debug mode (enable Grunt livereload, enable Flask debug mode)headless: headless mode (only search is available, no page is rendered)port: when launched with Flask development server only, port
Several attributes are supported:
name: the path to the graphtitle: title of the graph, recommended for display purposes (markdown syntax)family: the subsection in which the graph isindex: an optional list of keywords describing the graph (useful for search feature)text: an optional description of the graph (markdown syntax)pretext: an optional message appearing before the graph (markdown syntax)file: optional path to the raw dataexport: optional path to the exportable graph (for example, a PNG file)rank: integer, optional value used to change graphs order (default uses titles)showtitle: a boolean to toggle title display for the graph (default is false)labels: a list of labels (like'new') which will be rendered in the UI as colored circlesother: other metadata not used byGraphDash, but may be needed by other things reading the metadata
Note that if the name attribute is missing, the graph will not be
shown and the text will be displayed anyway, like a blog entry.
You may put a .FAMILIES.yaml file at the root of the graph
directory. This file may contain metadata for families. It should be a
YAML list:
- family: chairs
  rank : 0
- family: tables
  rank : 1
  text: This is a description
  alias: This text will appear instead of "tables"
  labels: new
Each element of the list should be a dict containing:
family: the family consideredrank: integer, optional value used to change families order (default uses family name)text: an optional description of the family (markdown syntax)alias: an optional name who may be longer than the one in the url (useful to build nice urls)labels: a list of labels (likenew) which will be rendered in the UI as colored circles
Available labels are new, update, bugfix, warning,
error, ongoing, obsolete. You may give other labels which
will be rendered with defaults colors. For customization, you may
specify your own labels with a dict syntax:
labels:
- name: newlabel
  color: white
  text_color: black
  text: "NEW LABEL"
tooltip: nullIf you wish to contribute, you need Grunt to generate new css/js
files from sass/coffee source files.
npm install --no-bin-links # may need to repeat
grunt
Debugging can be made with source map files for browser supporting them
in their debugging tools. If not, the Gruntfile.js enables an option
to generate non-minified assets.
grunt --devWith the debug mode enabled, Grunt will use the livereload mechanism
to reload the browser if any file has changed (and Flask debug mode will
reload the server as well).
GraphDash --debug & # or python -m graphdash
grunt watch
If you used Gunicorn with a PID file, Grunt will automatically
reload it if any Python files change.
gunicorn -b 0.0.0.0:8888 --pid server.pid graphdash:app &
grunt watch
You can use tox build packages and run tests.
tox