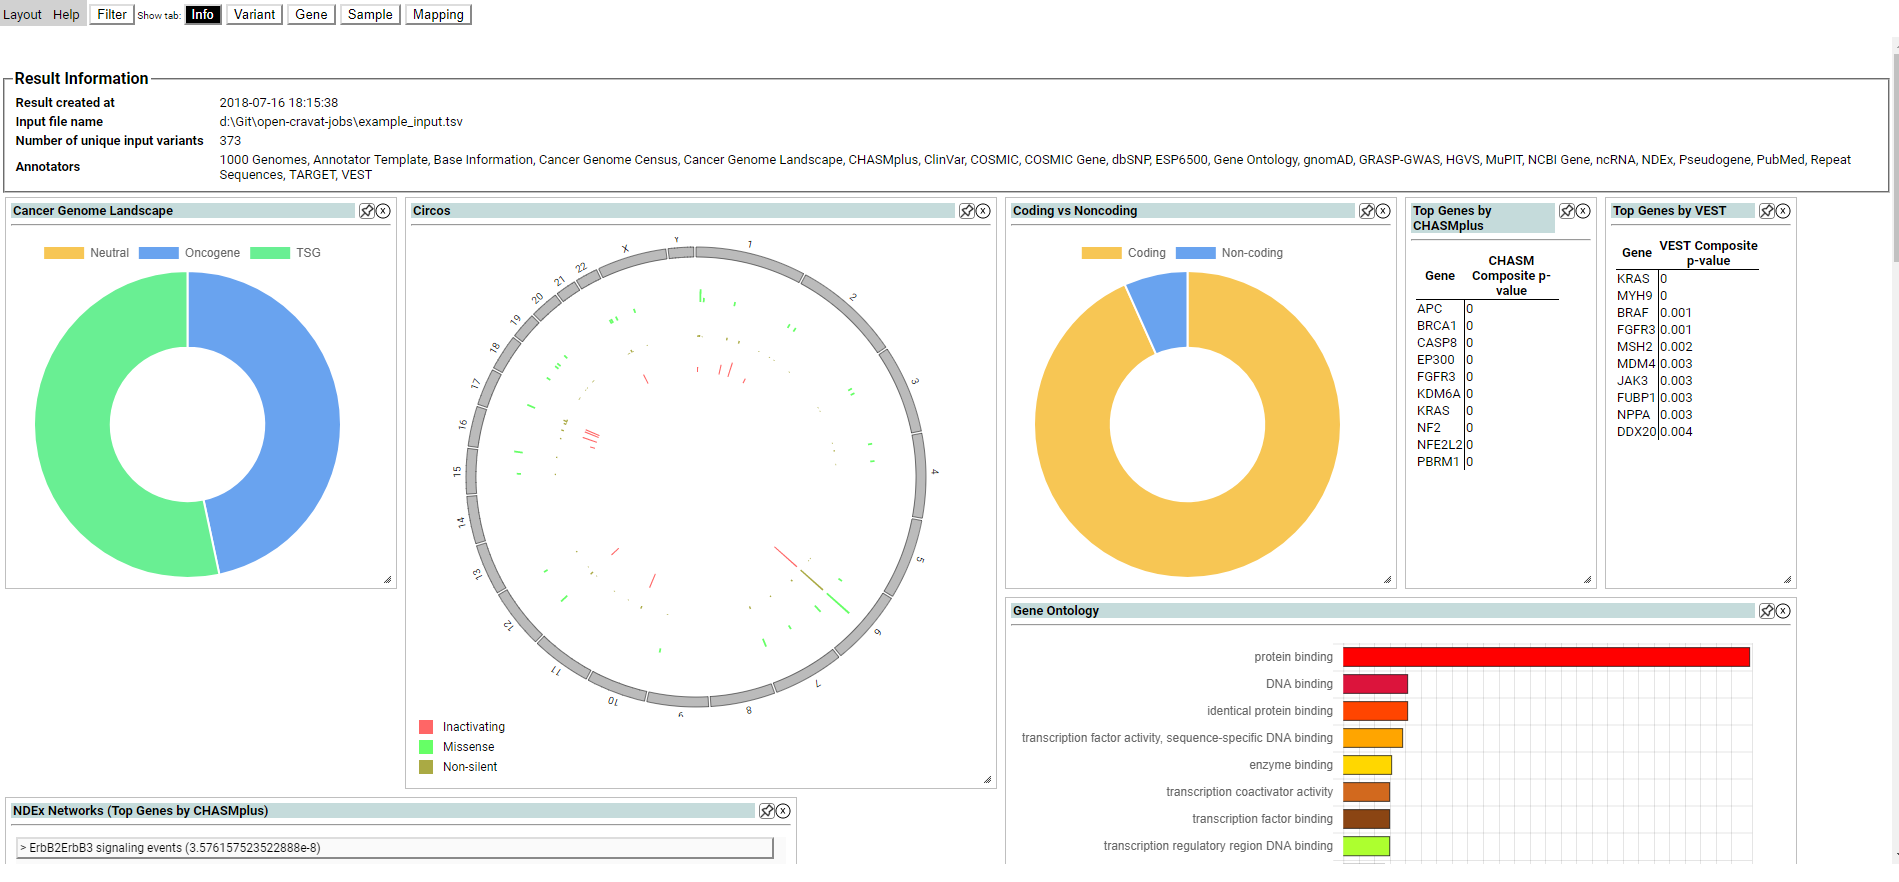
At the end of a run, CRAVAT can generate multiple types of reports in
both human and machine readable formats. These reports contain the
variant and gene data generated by the annotators that were run in this
CRAVAT job. By default either an excel or text report is generated at
the end of the run . The type of default report generated can be changed
using the reporter key in the cravat.yml file in the modules
directory. CRAVAT comes with an interactive web viewer, which can be
launched at any time using the oc gui command.
Multiple reports can be generated in a run by using the -t flag.
oc run input.vcf -t text excelThis command will launch a web server and a browser tab with Open-CRAVAT's web result viewer. To end the web server on your terminal, press Ctrl-C or Ctrl-Break. To know how you can press Ctrl-Break, see here.
Each job also generates a SQLite database which stores the complete
record of all data generated during the run. This SQLite database is
placed in the same directory as the input file and is named
{input_file_name}.sqlite. the name and location will be different if
CRAVAT was run with the -n or -d flags. This SQLite database can
be queried by advanced users if desired.
The interactive viewer is used to explore the CRAVAT results using
filters, tables, and visualizations. It is launched by passing a job
result database to oc gui.
oc gui job.sqliteBy default the database is placed in the same directory as the input
file, and is named by appending .sqlite to the end of the input file
name. This will change if OpenCRAVAT is run with the -n or -d
flags.
The above command will start a local python server and open a webpage using your default browser. The webpage is the interactive viewer. It is organized by tabs, shown at the top of the screen. The tabs are similar to the excel report sheets and text report sections.
The Summary tab shows overall information about the job, and can be used to create, save, and load filters.
The Summary tab may also contain graphical summary widgets, which provide a high level overview of the job. Only the summary widgets installed are displayed. CRAVAT includes some widgets by default, and more can be found in the CRAVAT store. Some widgets depend on specific annotators. Widgets on the Summary tab can be resized, hidden and rearranged similarly to the widgets in the variant tab, which is explained below.
OpenCRAVAT filters can be applied to any annotation and affect the results displayed across the entire viewer. When the filter is changed, the data passed to every other tab, table, or widget is only the data which passes the filter.
To add filters, select the filter menu from the top bar. Individual filters are created using the drop-down menu in the Variant Filters box. As filters are created and adjusted, the number of variants passing the filter is shown below. When the update button is pressed, the viewer loads the variants and genes which passed the filters.
Filters can also be saved so that they are available across viewer sessions. Click the save button near the top of the filter menu to give a filter set a name, and save it to the sqlite database. Then the filter can be reloaded by clicking the load button, and entering the name of the saved filter. Multiple filter sets may be saved and loaded.
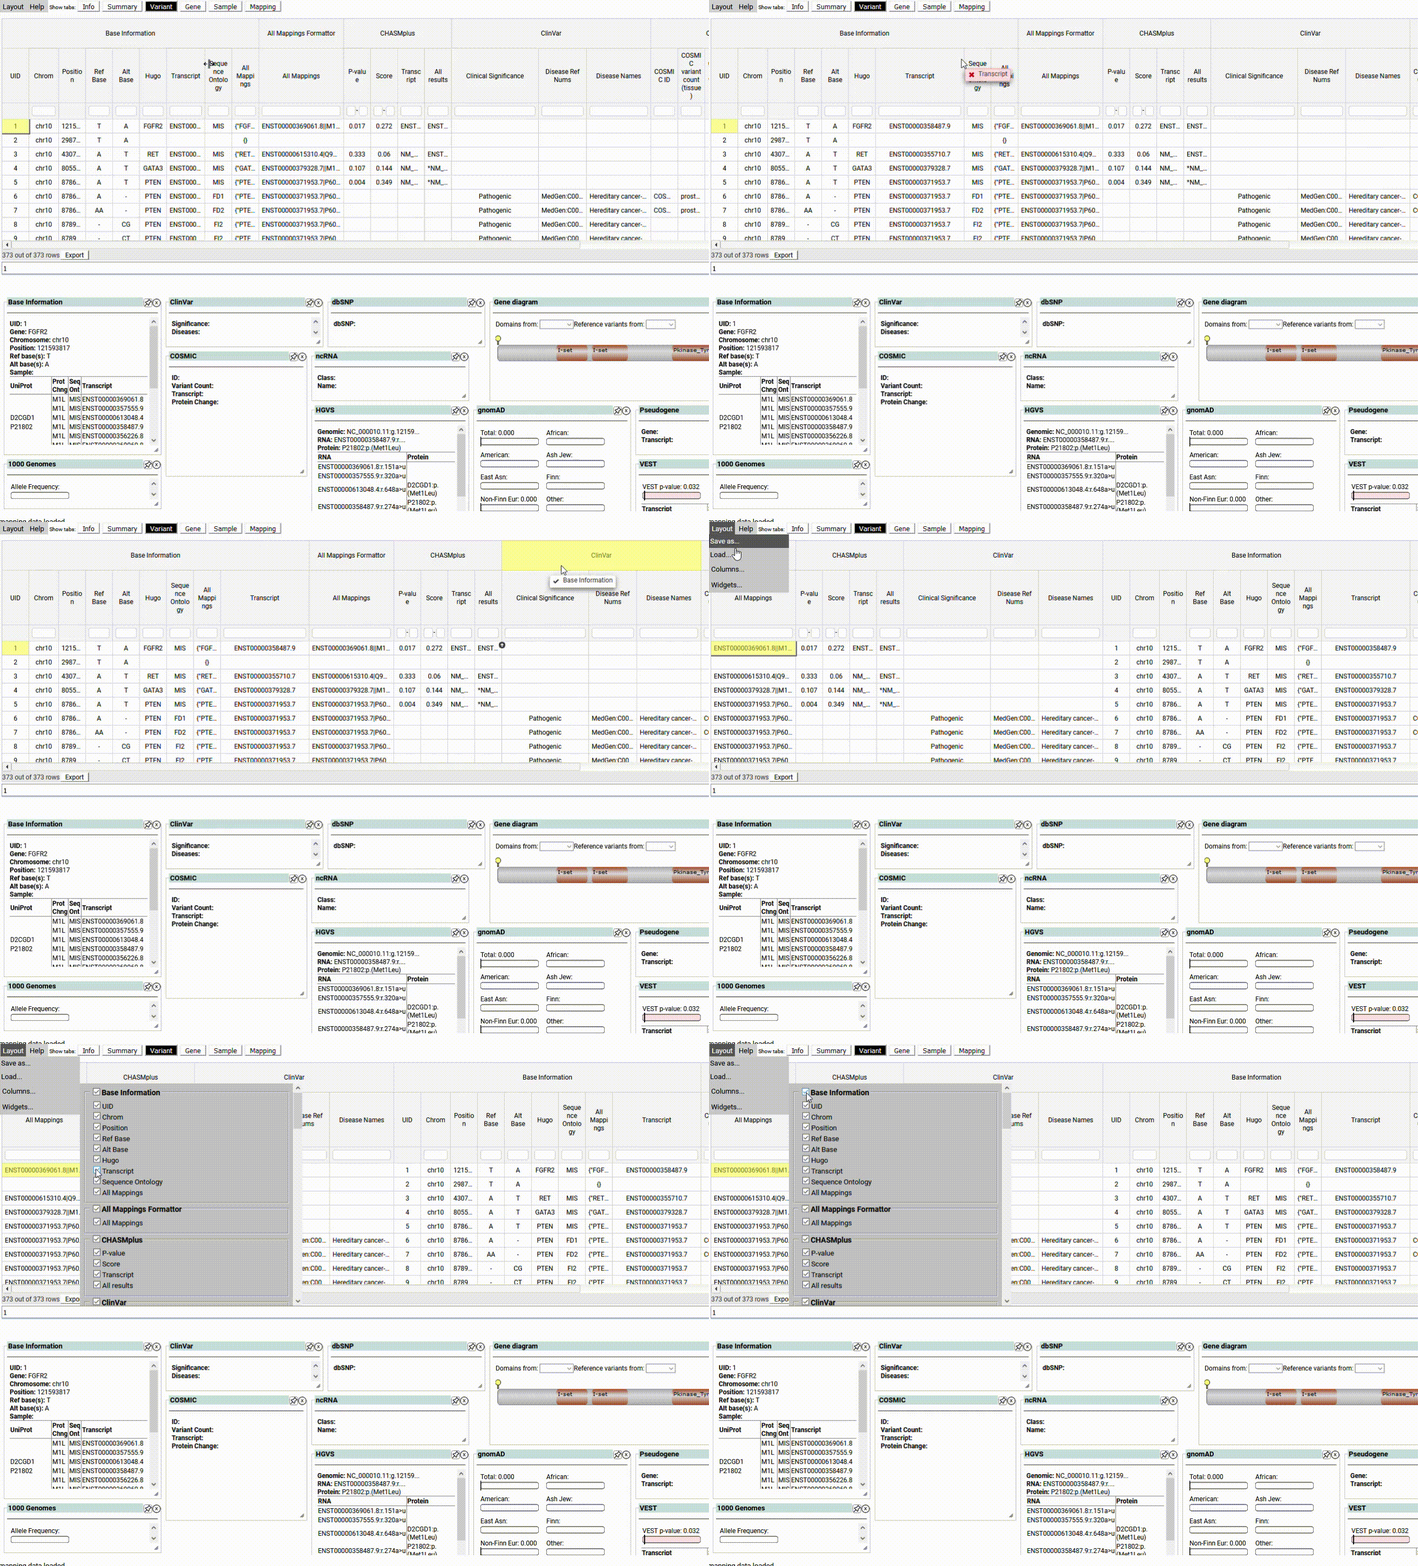
The Variant tab is one of the main data display tabs in CRAVAT. It is divided into two sections, a data table, and a collection of visualization widgets.
For each variant, we select a representative transcript isoform using EMBL-EBI MANE. Splice variants are defined as variants within two base pairs of an exon-exon junction.
The data table shows all of the annotations available, grouped by annotator. Columns may be resized, and moved individually or as a group. Move columns/groups by clicking and dragging their header. Columns can also be removed or added to the table using the layout drop-down menu in the top left of the page.
The visualization widgets section displays a visual summary of the current row in the data table. It is designed so that the user can quickly move through the data table and understand the contents of a row at a glance.
Widgets can be manipulated in different ways. They can be resized and moved using the mouse. Widgets can be hidden by either clicking on the x button, or by using the layout menu in the top left. Hidden widgets can also be displayed again using the layout menu. Layouts can be saved and loaded to preserve certain views, or to create a check-point before making major layout changes.
Saving a layout will save the columns displayed, column order, widgets displayed, widget size, and widget order. Like filters, saved layouts are available across viewer sessions.
The Gene tab is identical to the variant tab, but displays gene level information.
By default, the Excel output report is called {input_file_name}.xlsx. The
name will be different if CRAVAT was run with the -n or -d
flags. It consists of multiple pages:
- Info - A title sheet including information about the run
- Variant - Variant level information. Each variant has a row, and columns are grouped together by annotator.
- Gene - Gene level information. Formatted like the variant tab.
- Sample - Variant ids and the samples they occur in.
- Mapping - A Mapping or original input lines to the variant ids and user supplied tags they contain.
The text report is a tab separated file consisting of multiple sections.
The sections match those in the excel report. By default, the text
report is called {input_file_name}.tsv. The name will be different if
CRAVAT was run with the -n or -d flags.


