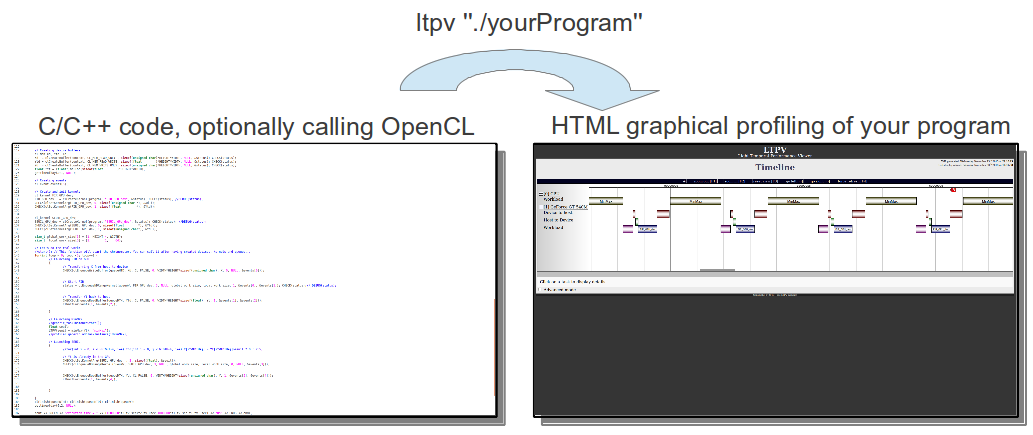
LTPV is a light and generic profiler for High Performance Computing applications. It can be used as an OpenCL profiler.
LTPV is a light and generic profiler for High Performance Computing applications. It aims at easily profile C/C++ application using or not the OpenCL library. It results from the lack of an easy-to-use profiler for OpenCL applications.
- as a zip archive: https://github.com/LTPV/LTPV/archive/master.zip
- with git: git clone https://github.com/LTPV/LTPV.git
Until now, this project was only used on Unix platform. Any help to make this profiler work with other architectures is welcomed.
Note that you will need administrator privileges to complete the installation.
- Open a terminal in ltpv/:
    cd ltpv/
    ./waf configure -m release
    ./waf
    sudo ./waf install
the library will be installed in /usr/local/ folder.
Since LTPV overwrite OpenCL function calls, you have nothing particular to do appart launching your program with :
ltpv ./my_gpu_program # this version will launch firefox when your program endsor
LD_PRELOAD=/path/to/libltpv.so ./my_gpu_programIn order to profile CPU function you have to include ltpv header into your project :
#include <ltpv.h>and compile you code with the libdl library
gcc ... -ldl ...Now, you can track CPU function by surrounding your code with:
LTPV(my_function_to_track());or
LTPV(my_function_to_track(), "My GPU function");or
LTPV(my_function_to_track(), "My GPU function", [id of the displayed queue on the viewer] );Note : ltpv.h contains only macros and functions relying on dynamic linking mecanisms. you don't need to link your program with libltpv at compilation time. however you should link with -ldl.
If you want to gather profiling infos. before the program ends (for example to get profiling information from intel OpenCL implementation)
LTPV_OPENCL_FINISH();Once your program terminate, a firefox window would popup with all profiling informations inside. Here some key features.
You can zoom in with [F2] key or with a left click-and-drag:

You can zoom in with [F1] key or by right-clicking.
- Zoom out, then zoom in somewhere else
- Use arrow keys: ⇦/⇨
You can either:
- Move you mouse over the task
- Click on it Furthermore, the advanced view gives you more detailed informations and a raw array of the XML provided informations.
This project is under GNU LGPL 2.1 See LICENSE for more information.
(Alphabetic order)
- Simon Denel (Thales SA)
- ixeft
You can contact us by filling in a new issue ! (nobody bites ;) )
