In order to assess the presence of proteins in a sample, the mass spectrometry data are compared to a reference - either in the form of a reference set of spectra, a spectral library, or a reference set of sequences, a protein database. Multiple tools can be used for this, sometimes embedded in larger bioinformatic pipelines. In this tutorial, we will navigate the result of proteomics identification, and will not cover how to obtain the results. For more details, please refer to our more extended tutorials.
This tutorial was written using PeptideShaker version 3.0.11 (1).
✏️ Download PeptideShaker here.
Navigating the identification results will allow you to assess the level of confidence of peptides and proteins in the dataset, view the corresponding spectra, and perform some quality control.
✏️ Start PeptideShaker and click Open Example.
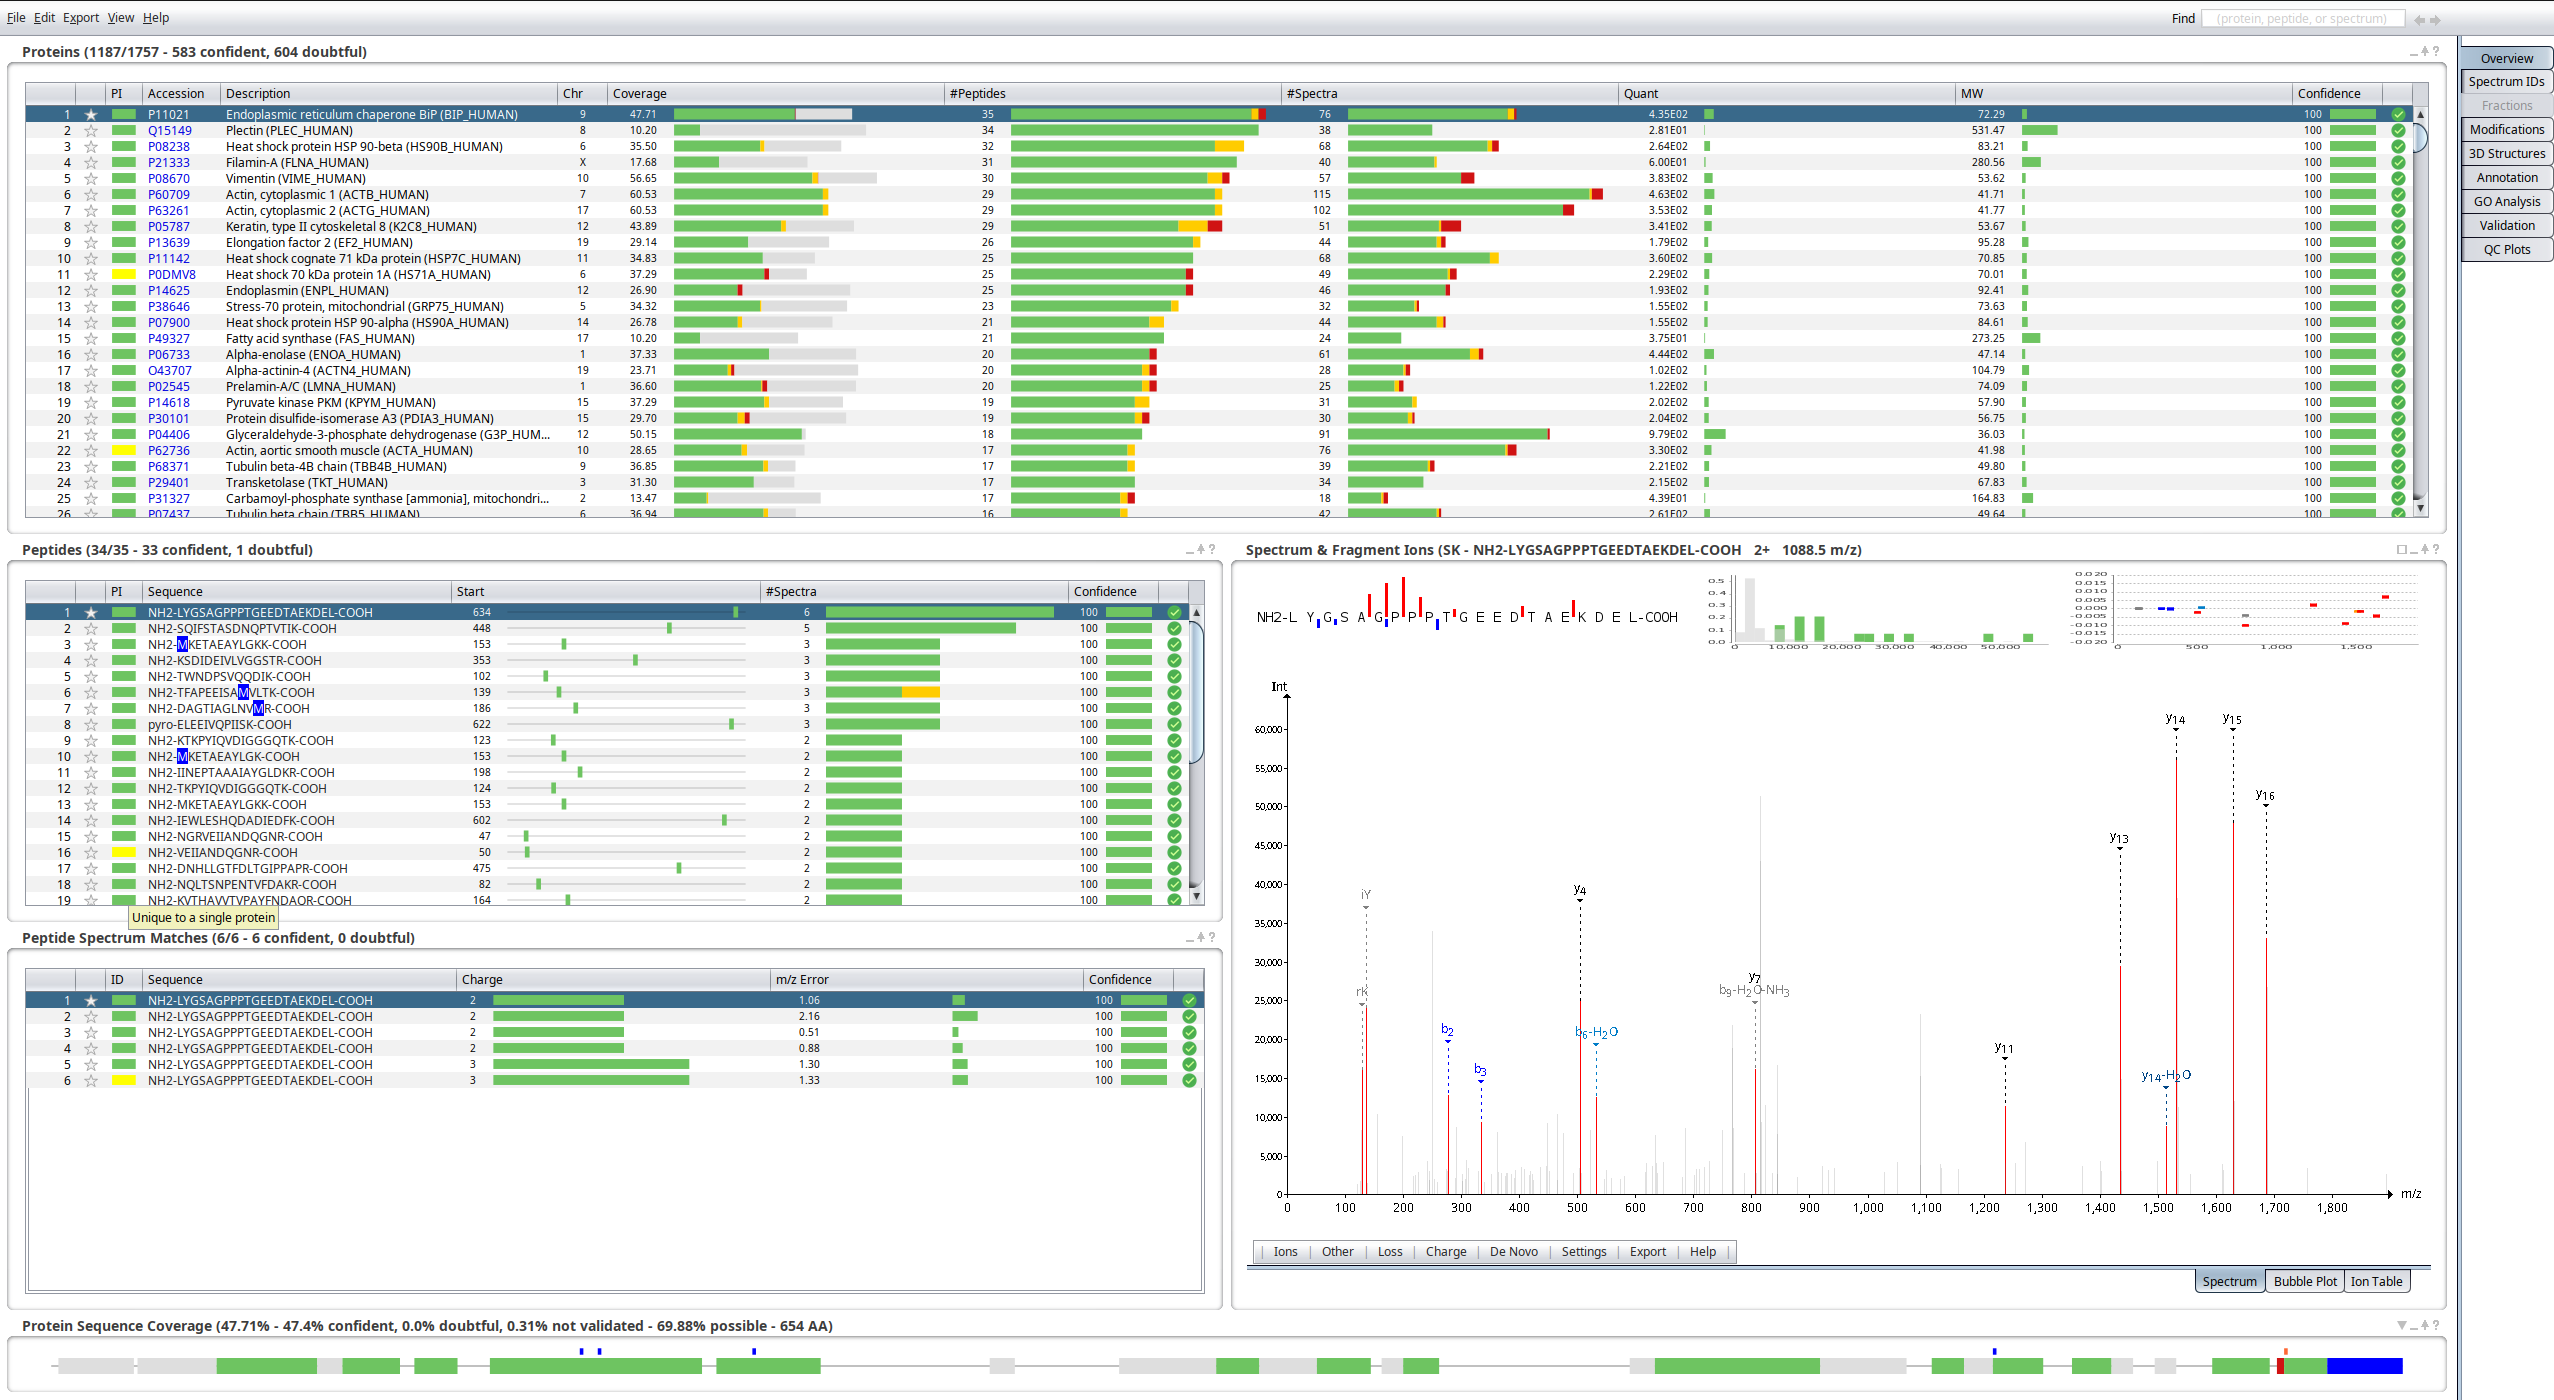
You should see the following screen.
At the top, you can see the results aggregated at the protein level; below to the left, the peptides for the selected protein, and the peptide to spectrum matches (PSMs) for the selected peptide; to the right, the annotated spectrum of the selected PSM; at the bottom, the protein sequence annotated with the peptides identified.
✏️ Click on the square above the spectrum to maximize the panel.
✏️ In the menu below the spectrum, enable the b-ions and y-ions menus under De Novo.
You should see the following annotated spectrum.
💬 What is displayed in the different plots? Do you feel confident that this spectrum was derived from this peptide?
✏️ Minimize the spectrum by clicking the square again.
As you can see in the spectrum table, this peptide was found in six spectra.
💭3 Why is the same peptide identified with charge 2 and 3?
The peptide table and protein sequence at the bottom show the peptides attributed to the selected protein.
💭4 Do we cover the entire sequence? Is it possible to have 100% coverage?
💬 What is annotated in the different columns of the protein table?
You might have noticed that a protein has a yellow reactangle in the PI column.
✏️ Click the yellow rectangle.
The dialog below should appear.
This graph displays the relationships between peptides (in blue) mapping to proteins (in red). When creating the project, PeptideShaker grouped peptides based on the protein sequence they can be mapped to. If a peptide maps to multiple proteins, it is called a shared peptide, or degenerated peptide, conversely, a peptide mapping to a single protein is called unique or proteotypic.
💬 So... Proteomics does not identify proteins?
✏️ Close the protein inference dialog, minimize the peptide, PSM, and spectrum panels.
You should see the following screen.
✏️ Scroll down in the protein table.
You should see the number of peptides and spectra per protein diminish. Around line 600, the green icon in the last column changes into a warning sign.
✏️ Click on the warning sign, you should see the following dialog appear.
As you can see in the Quality Filters table, the protein was marked with a warning sign because less than two confident peptides and PSMs were found.
💬 Why require two confident peptides per protein?
As you scroll further down, you will see that the icon in the last column turns red. This is the limit of what we consider as valid identification results, the rest is not validated.
✏️ Scroll further down.
The limit is set at a specific False Discovery Rate (FDR) of 1%. This means that among the proteins that do not carry a red icon, we expect a maximum of 1% false positives. You might have noticed that each protein carries an individual confidence level.
💬 What is the difference between a low FDR and a high confidence?
All proteins and peptides are categorized using three colors: (1) Green, passed the validation threshold and quality filters; (2) passed the validation threshold but not the quality filters; and (3) Red, did not pass the validation threshold.
✏️ Go to the Validation panel.
You should see the following screen.
In this panel, you can tune the validation threshold and visualize the balance between threshold stringency and high coverage.
💬 Is it better to have a low FDR, or a high number of proteins?
(1) PeptideShaker enables reanalysis of MS-derived proteomics data sets


