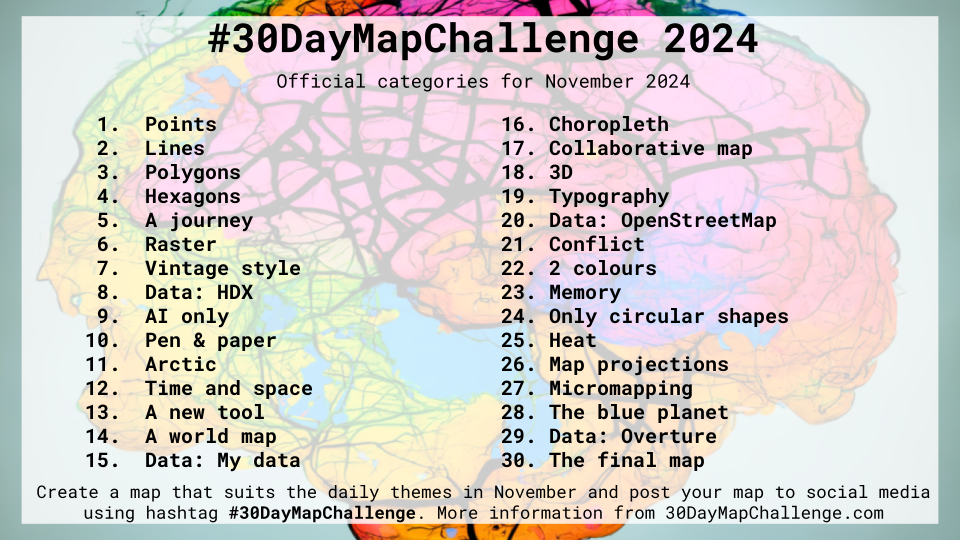
The #30DayMapChallenge is an event which gathers mappers on social media each November since 2019. The challenge is to produce a map for each of the 30 days of November, following the set of themes / topics / constraints set by the organisers.
This year, we participate in the #30DayMapChallenge as a group: Rbanism. Given our community focus on the programming language R, we add a constraint to the challenge: each map has to be made using R.
If you would like to join the challenge, you can:
- You pick a topic that interests you and put your name next to it here (if you haven’t already). We welcome multiple maps or map-makers per topic, so feel free to work on any topic that you wish (…but if you like a topic with no name on it, that’s even better and maybe we can complete the challenge with a map for each day)
- You make your map (or try to make the make. You can find resources on our GitHub page or reach out if you’re stuck) then, at least one day before the date of your topic, A) you send it to [email protected] or B) you send a Pull Request to GitHub. In any case, please make sure your map contains the Rbanism logo, the #30DayMayChallenge, appropriate data sources, licenses, and author credits (This is crucial for sharing our work!). See here how to add these to a ggplot map.
- We’ll post the maps weekly on our instagram account and on working days on our BlueSky account @rbanism.bsky.social with the hashtags #Rbanism #30DayMapChallenge2024 #30DayMapChallenge2024_Rbanism. We will also keep an archive of the challenge for our website rbanism.org, and try to organise a mini-exhibition at the Faculty sometime in December.
This can be a great opportunity to work on your mapping skills with R, to experiment with new packages and new functions, and to link with fellow mappers at TU Delft. We're looking forward to see what Rbanism comes up with as a community, and will host the result on our website.
- Geospatial Data Carpentry for Urbanism provides a comprehensive guide on how you can work with raster and vector data in R.
Purple: #93278F
Teal: #00A99D
Orange: #F7931E
#install.packages(c("magick","grid"))     # install if needed
library(magick)
library(grid)

rbanism_logo <- image_read('https://rbanism.org/assets/imgs/about/vi_l.jpg') # Download our logo

ggplot()                                   # make your map

grid.raster(rbanism_logo, x = 0.9, y=0.9,  # x and y determine the position of the logo (top right)
            width = unit(100, "points"))   # width determines the size of the logo
- Check the presentation, template and map examples on GitHub.
- You can use Rbanism color hexcodes for visual references, but feel free to use other colors of your preference
- Make sure your map includes the challenge date and topic (ideally as part of the title), author credits, data sources, licenses, the Rbanism logo and #30DayMayChallenge hashtag. See our examples here and here.
- Export you map into a
.pngimage. You can use theggsavefunction if using theggplot2package for mapping. See our examples here and here.
- Create a folder whose title is “challengedate_challengetopic”, containing: 1) the data 2) R code 3) PNG of the map. See our examples here and here.
- Send the zipped folder to [email protected] or 2) send a Pull Request on GitHub at least one day before the date of your topic.
- Collect your chocolate in the advent calendar taped to the #30DayMapChallenge poster in the urbanism coffee area (close to the room we had our kick-off). You deserve it!
*If you want your author credits to be shared on our social media, please share your instagram handle with the submission! If via email, simply add it to the mail, if via GitHub, please add a .txt file within the folder.
On BlueSky
On Instagram
If there any ideas, questions, or uncertainties regarding the challenge, please don’t hesitate to reach out to us via [email protected] !
=======

