This is a set of scripts that take .csv files and generate diagrams for easy analysis of measurements.
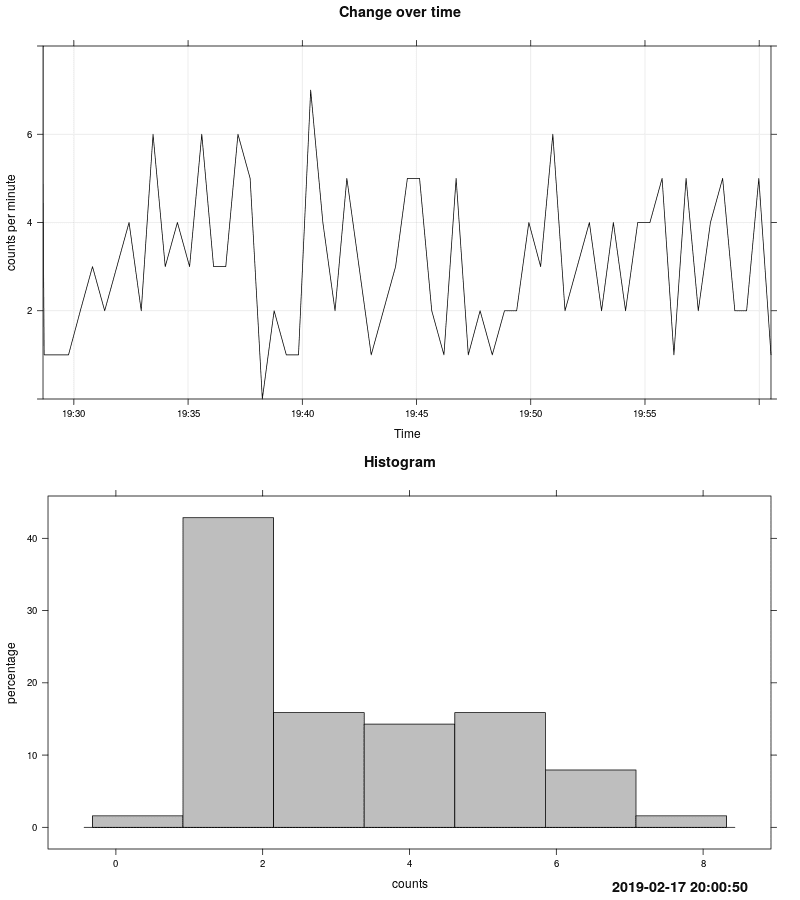
This mode is useful for observing measurement changes over time.
After collecting data, run the script to post-process it and generate diagrams:
Rscript main.R
A new .png image with a timestamp in its name will be created in the directory where the script is located.
Below is an example of such a generated plot.
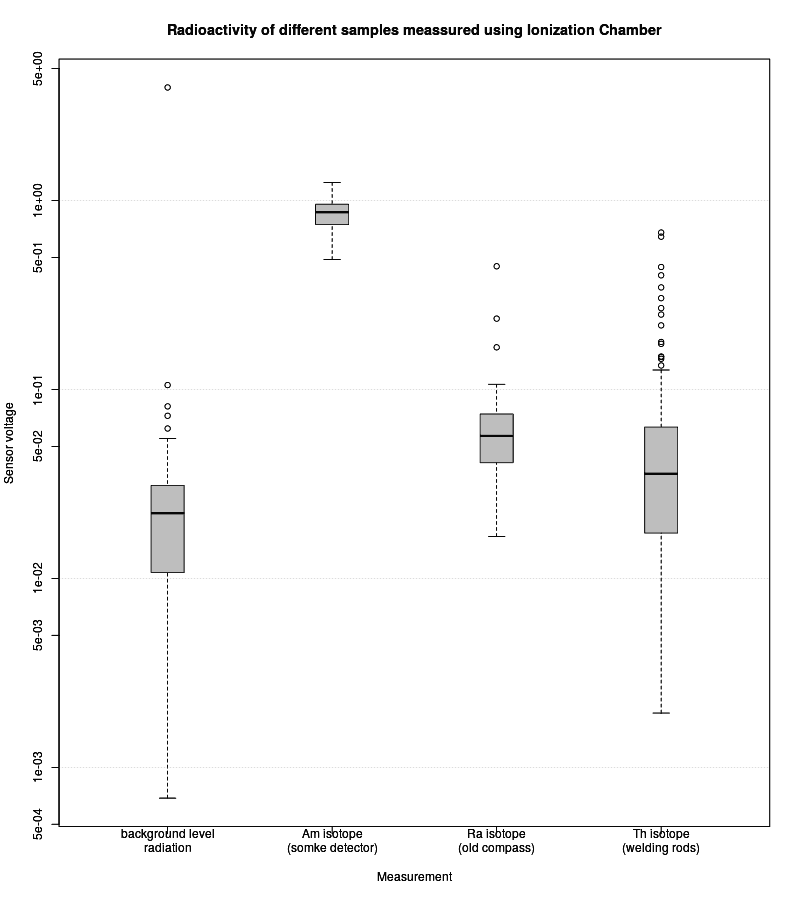
Plotting Values from Different Measurements (box plot)
Collect data from different samples as separate .csv files.
Edit boxplot.R to match the filenames of the .csv files and the labels of the measurements.
Run:
Rscript boxplot.R
A new .png image with a timestamp in its name will be created in the directory where the script is located.
Below is an example of such a generated plot.