Getting Zero values for CPU_Utlization metrics for IBM-i #12
Description
Hello,
I have configured the prometheus-exporter-jdbc on the IBM-i systems and I am able to pull-off the data on Grafana dashboards as wel. I am able to get the data for all the metrics but not for the following,
- AVERAGE_CPU_RATE
- AVERAGE_CPU_UTILIZATION
- AVERAGE_CPU_RATE_REAL
- AVERAGE_CPU_UTILIZATION_REAL
- MINIMUM_CPU_UTILIZATION
- MAXIMUM_CPU_UTILIZATION
- SQL_CPU_UTILIZATION
Though, we are able to get values when we are running the SQL commands locally on the IBM-i machines.
Following are some screenshots of Prometheus metric data that we are receiving from the IBM-i machines,
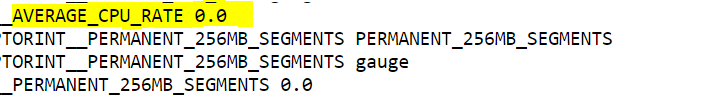
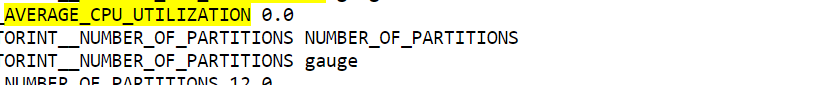
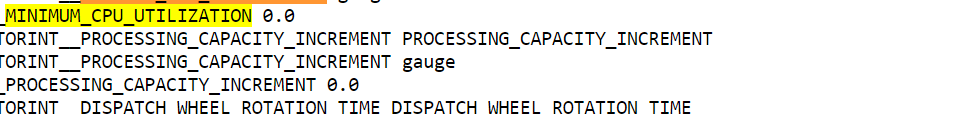
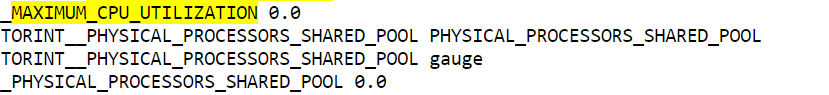
Could you please help us in this regard?
Thanks
Varun Wadhwani