Provide a graphical representation of the state chart for easier analysis #72
Comments
|
Hi Lucas, thanks a lot for taking the time to write all this. I agree that the string events are not ideal but given we need to interact with it from code, it's about the only thing we can do here. I can think of a few things to improve handling here:
Now for the visual editor. I totally get the appeal of it and I'm a big fan of visual editing - I made OpenSCAD Graph Editor. I still decided against doing it for a few reasons:
Finally, the amount of code needed for graph editor would very likely exceed the amount of code needed for everything else (I've got some experience on that with the OpenSCAD Graph Editor). I feel, that this time can better be spent elsewhere (for example this event name refactoring you suggested), especially given that a graph editor would not even be a better editing experience. What are your thoughts on this? |


|
My experience with many different state machines both in Godot and Unreal show that Graph view is not that usefull if they don't support features that Godot Scene system already supports (and usually they don't). Those would be instancing, hierarchy, API to manage nodes and their flow through scripts and serializableto file modules. I realy like current approach that State Charts uses. It's compact, fast to edit, easy to reause, modular and easy to extend. Only two things I miss is refactoring tool for events, or the possibility to use predefined structure containing events, that would also help with maintaining documentation for State Trees. Thanks for a great add-on! 😁 |
|
What are your thoughts on using nodes instead of strings for events? So instead of doing $StateChart.send_event("attacked") You could create an $StateChart/Attacked.send_event()Or something like that. This also has the benefits of having all the events in the node tree, so you don't have to remember all rhe events that you've defined. |
|
I have a feeling this would introduce additional problems. Right now the problem is that we may have a typo in our event names somewhere. If we replace this by nodes we get additional sources of problems: @onready var _my_event:Event = $Graph/MyEvent The node path is essentially also a @export var my_event:Event
# or
@export_nodepath("Event") var my_event:NodePath This would fix the typo problem and would also potentially be auto-fixed by Godot when you move nodes around, but you still may forget to select an event in your export (which will then produce a null problem) or you may even select an event from a different state chart than the one you are working with. Also this would be detrimental to the usability of the library, you now need to create extra nodes and reference them just to send an event to the state chart. Finally this would be a breaking change breaking all existing projects out there. So I think providing an explicit refactoring for the event names and giving some autocomplete to prevent typos is less invasive and will hopefully not introduce additional sources of errors. |
|
Hello @derkork , thank you for the feedback. I really liked the autocomplete idea for the event field, but I believe there's nothing ready in Godot to implement this UI. I explored Godot a bit and found a trick using VSCode to refactor event names. Since scenes are not binary, VSCode interprets them as code and finds the references correctly, so it's just a matter of replacing them with the new value.
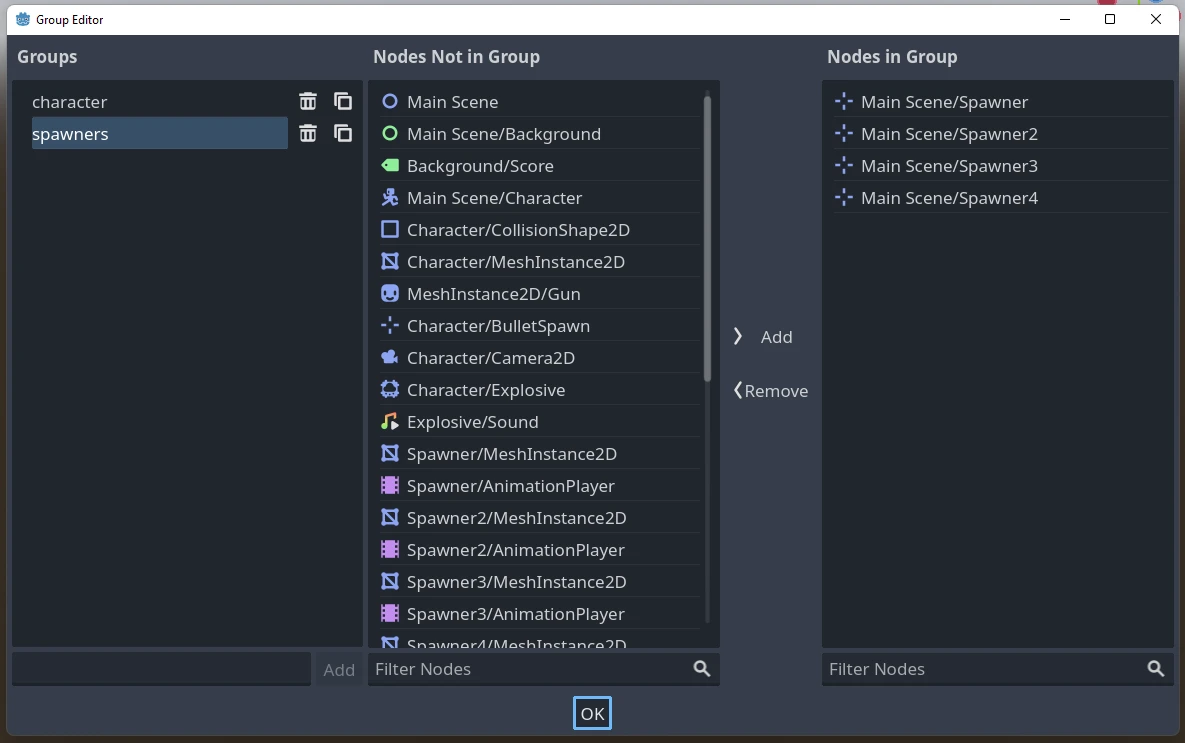
I like the idea of having the option to refactor event names through the plugin itself. After some thought, I think we can design it similar to Godot's group manager. Keeping things as simple as possible seems interesting to me. Representing events as just a string seems like a good option, essentially making it a tag. This simplifies the use of the plugin, similar to Godot groups. Godot has the Group Manager, which has an interface that displays indexed values (nodes present or not in a group) and facilitates batch editing. Bringing this to the context of the plugin, it could be a list of registered events, transitions related to the event (perhaps even an option to add/link a new transition), and scripts associated with the event. From what I've seen, fetching and editing this information seems straightforward. The idea is to have something that facilitates batch editing of events and possibly expand to other plugin operations in the future. Graphical EditingRegarding graphical editing, I hadn't paid attention to the details of data representation. What I had in mind was a visual representation of the tree. A correct visual representation of NinjaFrog would look like this:
While practice and a well-defined approach may make it faster to create through nodes, having a visual representation could make it easier for some users. In more complex scenarios, visualizing and editing through Godot's node tree can become challenging. I moved almost all conditions and states of the player to the StateChart in one of my projects. The code became clean, but in the tree, I have 73 nodes, including CompoundState, AtomicState, and Transition. Collapsing the editor and looking at one at a time is fine, but understanding the overall context and how states relate would be easier in a graph. Is there perhaps something already available in the Godot ecosystem? Like a tree editor – the Beehave debug seems somewhat like that, but I haven't tested it. I understand that the visual aspect is extensive to program, but I believe we can define how it could be included in the plugin and identify the steps needed to complete it. As more people express interest in this feature, they could contribute to the plugin's development. I am someone who, in my spare time, could easily program one thing or another and over time it would end up being ready, but if there were more people willing to help it would be great 😁 |


|
Autocomplete may actually be possible. There is nothing built in, but with a bit of event handling and custom drawing it might just work... 2024-01-07_22-54-06.mp4Still need the selection but looks definitely doable. |
|
Okay, so the autocomplete idea didn't materialize after all, the issue is that while I can totally draw a completion popup, I cannot really detect the mouse on it. So I settled for a popup, which basically does the same thing and since it also supports typing it's almost a typeahead. I also added a facility to rename events together with full undo/redo support. 2024-01-12_22-04-33.mp4I think this is already a nice improvement over the current status and i prefer a workable solution that I can have now over a perfect one that may never come. |
|
I prefer this over (just) a simple autocomplete imo being able to view and edit the events in the popup is a huge improvement |
|
Released as 0.12.0. As for the visualization, I totally like the idea. However auto-layouting graphs is far from a solved problem. Most graph layouting tools I have seen produce abysmal results and not for a lack of trying. I actually have only seen one implementation that produces half-way decent results (yFiles) and this is both exceptionally expensive (licenses start at 22k€) and not compatible with Godot. So any ideas how a graph layouter could actually work? |
Overview
Recently, I've extensively used and tested the plugin, creating prototypes and more. However, after validating a mechanic, I realized that I had used an inappropriate name for an event, violating best practices and clean code principles. I went ahead to rename the event, which proved to be a bit tedious. While changing the code was straightforward, manually updating event names in all states was necessary.
After completing the renaming process, everything continued to work normally. Nevertheless, I identified an opportunity to enhance this aspect by abstracting and simplifying it within the plugin. My suggestion is to introduce an option for event registration, allowing users to select registered events or enter. If an event is selected, it would only update the String value. In principle, this way would have a more user-friendly interface and would maintain compatibility with existing projects.
Visual State Construction
I also asked myself whether it would be possible to create a visual aspect of the State construction stage. In my research into graphics, I came across stately.ai, a tool with an interface that I really liked. I wondered if the plugin currently has a level of abstraction that allows the implementation of an interface using Godot's GraphEdit (Note: I haven't delved into the plugin's source code yet).
Comments and suggestions
I look forward to your feedback on these suggestions and appreciate your efforts in improving and maintaining the plugin.
The text was updated successfully, but these errors were encountered: