pvalue combining tests
Test combining pvalues from 1) the 2-ifo time slide background estimate 2) the 3+-ifo (new)SNR time series followup, using the Fisher method given a nominal analysis time.
Procedure followed:
- Convert 2-ifo coinc IFAR to p-value (p1) using a notional livetime (eg 0.001yr ~ 9 hours)
- Combine p1 with p-value resulting from 3rd ifo SNR time series (p2) via Fisher method
- Convert this combined p-value back to IFAR
- Take the maximum of this combined IFAR and the original 2-ifo IFAR to avoid any event being made much less significant by 'followup', apply trials factor of 2 to the result.
import numpy, pylab
from scipy.stats import combine_pvalues
def ftop(f, ft):
# calculates p-value corresponding to FAR 'f' and foreground time 'ft'
return 1 - numpy.exp(-ft * f)
def ptof(p, ft):
# calculates FAR corresponding to p-value 'p' and foreground time 'ft'
return numpy.log(1.0-p) / -ft
# use a fixed notional livetime to do conversions
ftime = 0.001
# IFAR from 2-ifo coinc background estimate
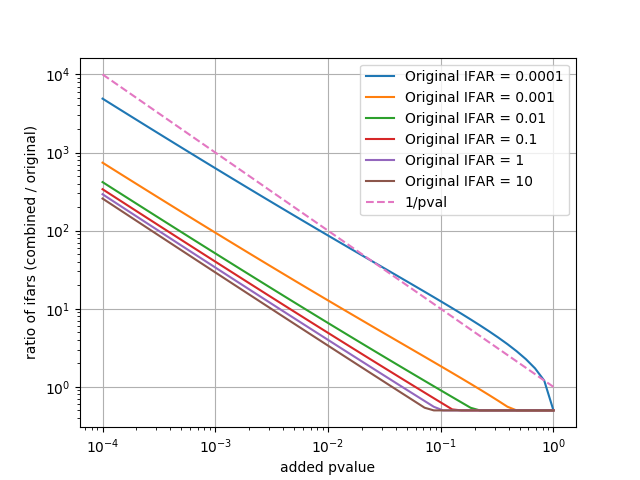
ifars = [0.0001, 0.001, 0.01, 0.1, 1, 10]
# 'added' p-values resulting from 3rd (etc.) ifo followup
pvalues = numpy.logspace(-4, 0, num=50)
for ifar in ifars:
# p-value from 2-ifo coinc IFAR
p1 = ftop(1.0/ifar, ftime)
# Fisher combination
cp = numpy.array([combine_pvalues([p1, p2])[1] for p2 in pvalues])
# new IFAR
nifar = 1.0 / ptof(cp, ftime)
# combine with original & take trials factor
mifar = numpy.maximum(ifar, nifar) / 2.0
pylab.plot(pvalues, mifar / ifar, label='Original IFAR = %s' % ifar)
pylab.plot(pvalues, 1.0/pvalues, linestyle='--', label='1/pval')
pylab.grid()
pylab.xscale('log')
pylab.yscale('log')
pylab.ylabel('ratio of ifars (combined / original)')
pylab.xlabel('added pvalue')
pylab.legend()
pylab.savefig('farchange_0p1_max.png')
Compare (1) scaling reference time to (2) fisher method with fixed reference time and (3) taking max of the combined pvalue and original pvalue with trials factor to minimize significance of certain candidates.
import numpy, pylab
from scipy.stats import combine_pvalues
from numpy.random import uniform
from numpy.random import seed
#seed(0)

def ptof(p, ft):
   return numpy.log(1.0 - p) / -ft

def ftop(f, ft):
   return 1 - numpy.exp(-ft * f)

def fisher_combine(p, q):
    combvals = [combine_pvalues([v1, v2], method='fisher')[1] for v1, v2 in zip(p, q)]
    return numpy.array(combvals)

size = 200000

# p1 represents 'original' result from 2-ifo bg
p1 = uniform(0, 1, size=size)
# p2 represents 3- or 3+n-ifo followup
p2 = uniform(0, 1, size=size)

print 'Combining with Fisher'
# combine (implicitly using actual livetime)
cp = fisher_combine(p1, p2)

ftime = 0.1  # choosing units so this is a little over a month
btime = ftime * size  # total time over all random trials

# 'ifars' is original 2-ifo IFAR
ifars = 1.0 / ptof(p1, ftime)
cifars = 1.0 / ptof(cp, ftime)

print 'Maximizing with trials factor'
# maximize between original and adjusted IFAR and add trials factor
mifars = numpy.maximum(ifars, cifars) / 2.0

# define cumulative rate to plot as y-axis for sorted output IFAR values
crate = numpy.arange(size, 0, -1) / btime

print 'Scaling and combining'

fixedlt = False
if fixedlt:
    # first 'scaling' method uses a fixed notional livetime
    lt = 0.5
    # convert original FARs to notional p-values
    p3 = ftop(1.0 / ifars, lt)
    cp2 = fisher_combine(p3, p2)
    sifar = 1.0 / ptof(cp2, lt)
else:
    # new 'scaling' method uses notional livetime of fac * 2-ifo IFAR
    # the p-value corresponding to this is always 1 - exp(-fac)
    # so calculate it for e.g. IFAR = foreground time
    ifarfac = 0.02
    lt = ifarfac * ifars
    p3 = ftop(1./ftime, ifarfac * ftime)
    cp2 = fisher_combine(p3 * numpy.ones_like(p2), p2)
    sifar = 1.0 / ptof(cp2, lt)

ifars.sort()
cifars.sort()
mifars.sort()
sifar.sort()

if fixedlt:
    pylab.plot(sifar, crate, label=r'scaling, $t=%.2g$' % lt, alpha=0.6)
else:
    pylab.plot(sifar, crate, label=r'scaling, $t=%.2g\times$IFAR$_0$' % ifarfac, alpha=0.6)
pylab.plot(cifars, crate, label='combined (Fisher)', alpha=0.6)
pylab.plot(mifars, crate, label='max(combined, coinc)', alpha=0.6)
pylab.plot(ifars, crate, label='original ifars', alpha=0.6)
pylab.plot(1./crate, crate, c='k', linestyle='--', label='1/IFAR', alpha=0.4)
pylab.legend()
pylab.xscale('log')
pylab.yscale('log')
pylab.ylabel('Cumulative Rate (/yr)')
pylab.xlabel('IFAR (yr)')
pylab.savefig('combining_0p02IFAR.png')
0.02yr 
0.05yr 
0.1yr 
0.5yr 
0.02 x IFAR 
0.05 x IFAR 
0.1 x IFAR 
0.5 x IFAR 