I can't reproduce the output shown in {ggalt} vignette.
Expected:

Observed:
library(ggplot2)
library(ggalt)
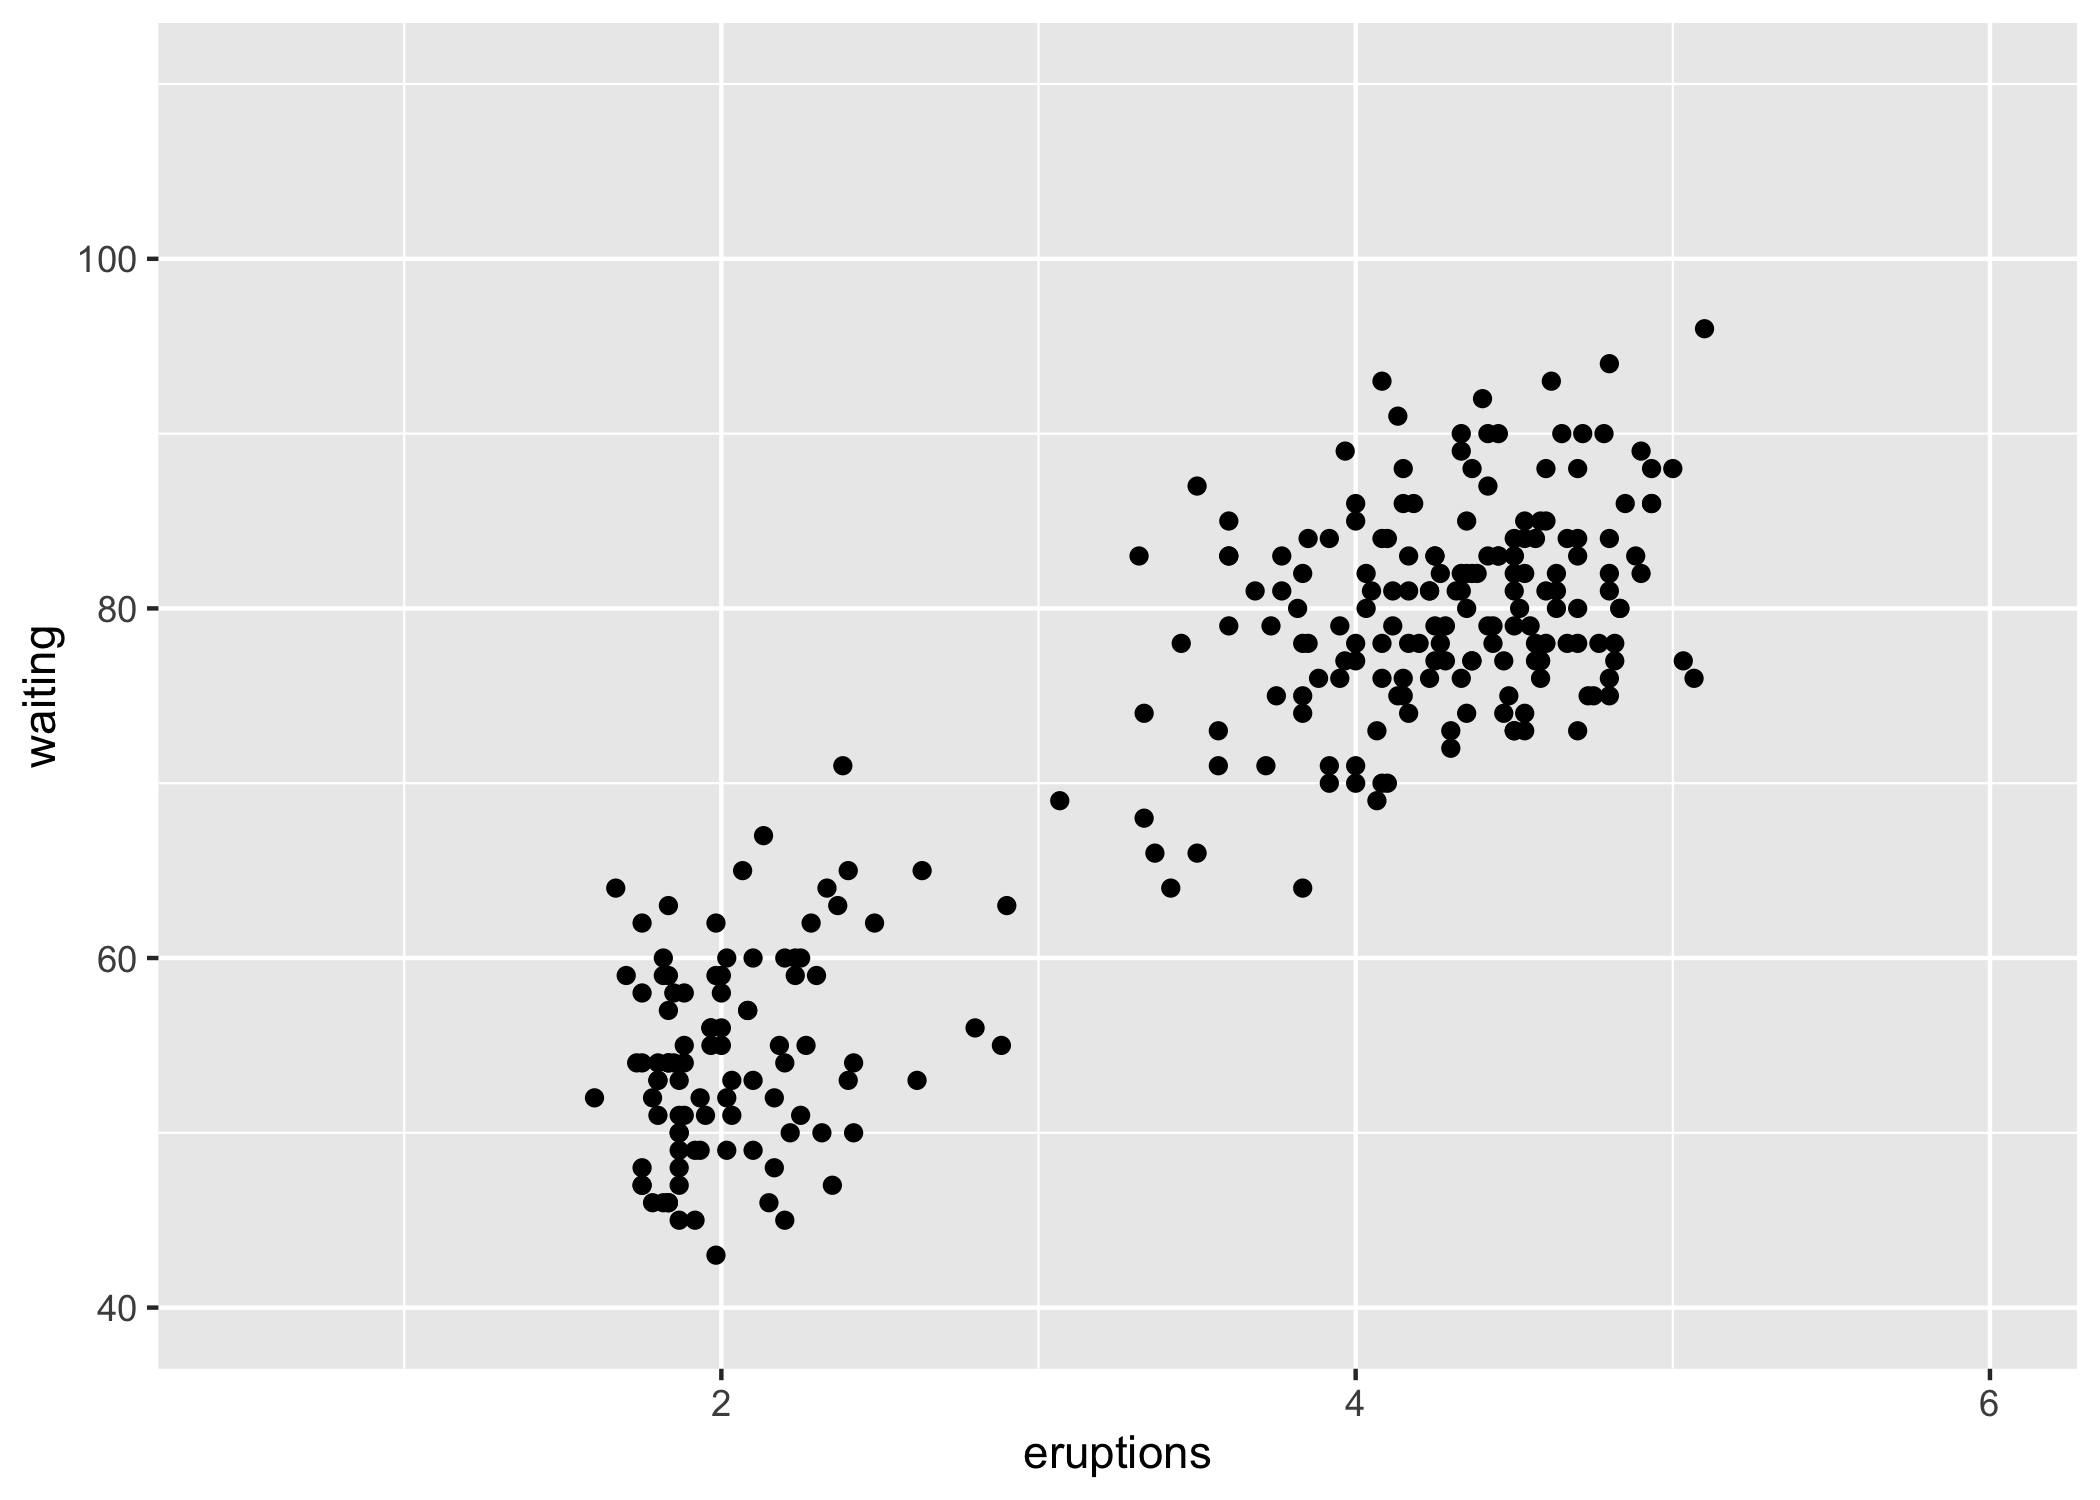
m <- ggplot(faithful, aes(x = eruptions, y = waiting)) +
geom_point() +
xlim(0.5, 6) +
ylim(40, 110)
m + geom_bkde2d(bandwidth = c(0.5, 4))
Created on 2021-08-15 by the reprex package (v2.0.1)
I can't reproduce the output shown in
{ggalt}vignette.Expected:
Observed:
Created on 2021-08-15 by the reprex package (v2.0.1)