Kubernetes cluster visualiser and visual explorer
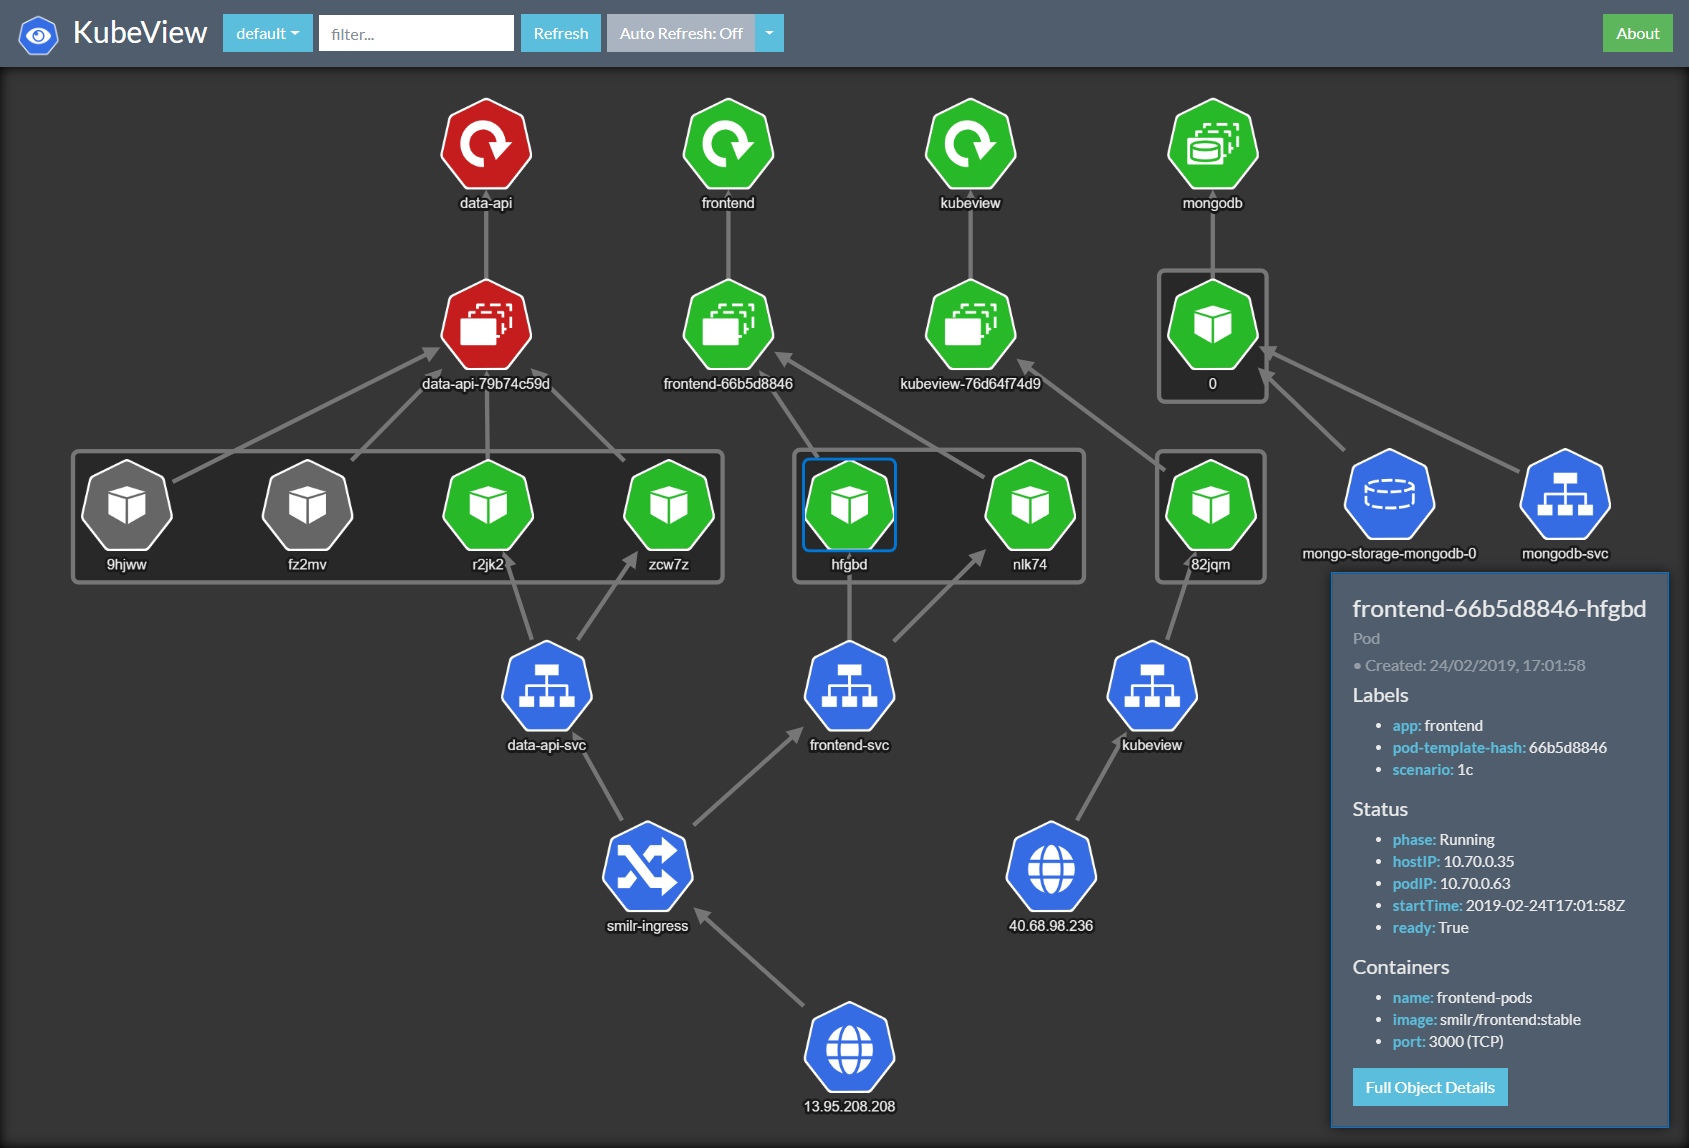
KubeView displays what is happening inside a Kubernetes cluster, it maps out the API objects and how they are interconnected. Data is fetched real-time from the Kubernetes API. The status of some objects (Pods, ReplicaSets, Deployments) is colour coded red/green to represent their status and health
The app auto refreshes and dynamically updates the view as new data comes in or changes
Currently displays:
- Deployments
- ReplicaSets / StatefulSets / DaemonSets
- Pods
- Services
- Ingresses
- LoadBalancer IPs
- PersistentVolumeClaims
Note. This is a work in progress ☢
- Client SPA - Vue.js single page app. All visualisation, mapping & logic done here
- API Server - Scrapes Kubernetes API and presents it back out as a custom REST API. Also acts as HTTP serving host to the SPA. Written in Go
This projects follows the 'Standard Go Project Layout' directory structure and naming conventions as described here
- /cmd/server - Source of the API server, written in Go
- /web/client - Source of the client app, written in Vue.js
- /deployments - Kubernetes deployment manifests and instructions
Here is the link for all these icons. I also changed the green/grey/red icons when needed. https://github.com/kubernetes/community/blob/master/icons/svg
it is easy to check which node the pod is allocated.
using go func can improve the performance of api query
- Filtering improvements (no refresh)
- Support some CRDs?
- Display Nodes?
- Security
- Add AI
- Profit
