El lenguaje Go tiene un gran diseño es la biblioteca estándar con herramientas de monitorización del rendimiento del código, hay paquetes en dos lugares:
net/http/pprof

runtime/pprof
In fact, net/http/pprof in just using runtime/pprof package for packaging a bit, and exposed on the http port
Actualmente beego marco agrega pprof, esta función no está activada de forma predeterminada, si usted necesita para poner a prueba el rendimiento, ver el goroutine ejecución dicha información, de hecho, el paquete por defecto de Go "net / http / pprof" ya cuenta con esta función y, si Go forma de acuerdo con el Web predeterminado, puede utilizar el valor predeterminado, sino porque beego función ServHTTP reenvasado, así que si usted no puede abrir el defecto incluye esta característica, por lo que la necesidad de una reforma interna beego apoyo pprof.
En primer lugar, en función de beego.Run automáticamente en función de si el paquete de rendimiento de carga variable
-
En primer lugar, en función de beego.Run automáticamente en función de si el paquete de rendimiento de carga variableck
if PprofOn { BeeApp.RegisterController(`/debug/pprof`, &ProfController{}) BeeApp.RegisterController(`/debug/pprof/:pp([\w]+)`, &ProfController{}) } -
Diseño ProfConterller
  package beego

  import (
  	"net/http/pprof"
  )

  type ProfController struct {
  	Controller
  }

  func (this *ProfController) Get() {
  	switch this.Ctx.Params[":pp"] {
  	default:
  		pprof.Index(this.Ctx.ResponseWriter, this.Ctx.Request)
  	case "":
  		pprof.Index(this.Ctx.ResponseWriter, this.Ctx.Request)
  	case "cmdline":
  		pprof.Cmdline(this.Ctx.ResponseWriter, this.Ctx.Request)
  	case "profile":
  		pprof.Profile(this.Ctx.ResponseWriter, this.Ctx.Request)
  	case "symbol":
  		pprof.Symbol(this.Ctx.ResponseWriter, this.Ctx.Request)
  	}
  	this.Ctx.ResponseWriter.WriteHeader(200)
  }
A través del diseño anterior, puede utilizar el siguiente código para abrir pprof:
beego.PprofOn = trueA continuación, puede abrir en un navegador la siguiente dirección URL para ver la siguiente interfaz:
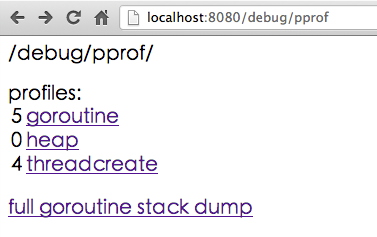
Figure 14.7 current system goroutine, heap, thread information
Click goroutine podemos ver una gran cantidad de información detallada:

Figure 14.8 shows the current goroutine details
También podemos conseguir más detalles de la información de la línea de comandos
go tool pprof http://localhost:8080/debug/pprof/profileEsta vez, el programa entrará en el tiempo de recogida de perfil de 30 segundos, tiempo durante el cual desesperadamente para actualizar la página en el navegador, tratar de hacer que los datos de rendimiento de uso de la CPU.
(pprof) top10

Total: 3 samples

   1 33.3% 33.3% 1 33.3% MHeap_AllocLocked

   1 33.3% 66.7% 1 33.3% os/exec.(*Cmd).closeDescriptors

   1 33.3% 100.0% 1 33.3% runtime.sigprocmask

   0 0.0% 100.0% 1 33.3% MCentral_Grow

   0 0.0% 100.0% 2 66.7% main.Compile

   0 0.0% 100.0% 2 66.7% main.compile

   0 0.0% 100.0% 2 66.7% main.run

   0 0.0% 100.0% 1 33.3% makeslice1

   0 0.0% 100.0% 2 66.7% net/http.(*ServeMux).ServeHTTP

   0 0.0% 100.0% 2 66.7% net/http.(*conn).serve

(pprof)web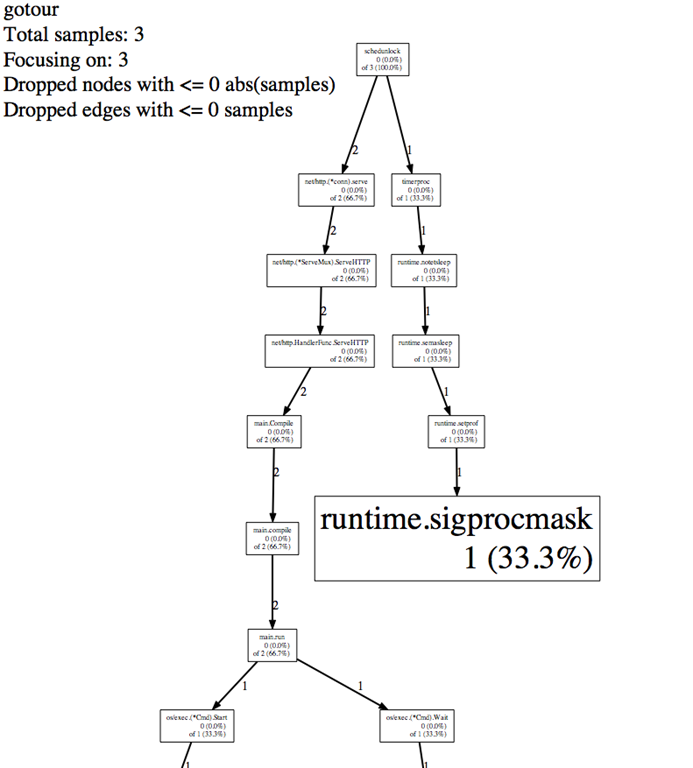
Figure 14.9 shows the execution flow of information
- Directory
- Previous section: Multi-language support
- Next section: Summary