Live Updating #57
Comments
|
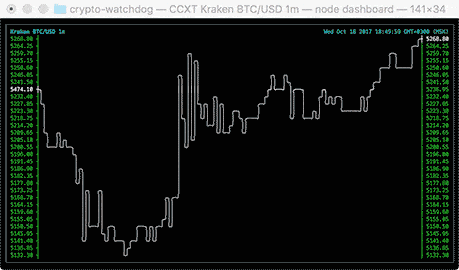
@tudorelu hey! ) Basically, that gif is compiled of screenshots taken once every minute on a redrawing chart. Automating those screenshots is an OS-specific task, but should not be a problem. If you redraw it in real-time from 1m-OHLCV candles, then your FPS is 1/60 (one frame per minute), which is very slow – you won't see any "smooth animation". Therefore, in reality, an OHLCV chart is a low-fps chart. You may want to pick a different source of data (like the current tip of the orderbook), that will indeed update very frequently, so you may even want to manually limit the upper boundary on fps to avoid eating too much cpu for redrawing the frames. Let me know if the above explanation does not help. |
|
Nice, thanks for the explanation! It's pretty clear. I was trying to figure out how to create the 'redrawing chart' in python - as opposed to simply printing the plot every 1 minute. I discovered curses, the python TUI tool, and made it work for plots using the default color without much hassle. Had to put in some effort to make it work with multiple colors, but now I have what I needed. One thing I noticed - when I resize my terminal window, my 'app' crashed. It might be because of curses though. |
|
@tudorelu you can also do the same without using curses: https://stackoverflow.com/questions/17309749/node-js-console-log-is-it-possible-to-update-a-line-rather-than-create-a-new-l by moving your cursor back up a few lines, effectively overwriting the entire chart on each frame, that makes it appear animated. |
|
@kroitor hi there. You'd better add the above description to the readme to explicitly say that this gif is not part of this library. It misleads actually. |
|
@MetaMmodern hi! That gif was built using a very basic shell script with this lib, i'll add instructions on how to make one. |
|
hi just wanted to stop to say this plotter is really really cool!! here is a little example for what i use your plotter for. I try to use it as a live serial plotter for sensor data on a rp2040. To scroll the plot I # wipe lines
for i in range(-1,len(result)): # range from -1 to scroll plot to the top or 0 to keep plot at position
print('\033[1A', end='\x1b[2K')this is really usable for smaller scales sample.movfull pythonfull pythonfrom __future__ import division
from math import ceil, floor, isnan
black = "\033[30m"
red = "\033[31m"
green = "\033[32m"
yellow = "\033[33m"
blue = "\033[34m"
magenta = "\033[35m"
cyan = "\033[36m"
lightgray = "\033[37m"
default = "\033[39m"
darkgray = "\033[90m"
lightred = "\033[91m"
lightgreen = "\033[92m"
lightyellow = "\033[93m"
lightblue = "\033[94m"
lightmagenta = "\033[95m"
lightcyan = "\033[96m"
white = "\033[97m"
reset = "\033[0m"
__all__ = [
'plot', 'black', 'red',
'green', 'yellow', 'blue',
'magenta', 'cyan', 'lightgray',
'default', 'darkgray', 'lightred',
'lightgreen', 'lightyellow', 'lightblue',
'lightmagenta', 'lightcyan', 'white', 'reset',
]
# Python 3.2 has math.isfinite, which could have been used, but to support older
# versions, this little helper is shorter than having to keep doing not isnan(),
# plus the double-negative of "not is not a number" is confusing, so this should
# help with readability.
def _isnum(n):
return not isnan(n)
def colored(char, color):
if not color:
return char
else:
return color + char + reset
def plot(series, cfg=None):
if len(series) == 0:
return ''
if not isinstance(series[0], list):
if all(isnan(n) for n in series):
return ''
else:
series = [series]
cfg = cfg or {}
colors = cfg.get('colors', [None])
minimum = cfg.get('min', min(filter(_isnum, [j for i in series for j in i])))
maximum = cfg.get('max', max(filter(_isnum, [j for i in series for j in i])))
default_symbols = ['┼', '┤', '╶', '╴', '─', '╰', '╭', '╮', '╯', '│']
symbols = cfg.get('symbols', default_symbols)
if minimum > maximum:
raise ValueError('The min value cannot exceed the max value.')
interval = maximum - minimum
offset = cfg.get('offset', 3)
height = cfg.get('height', interval)
ratio = height / interval if interval > 0 else 1
min2 = int(floor(minimum * ratio))
max2 = int(ceil(maximum * ratio))
def clamp(n):
return min(max(n, minimum), maximum)
def scaled(y):
return int(round(clamp(y) * ratio) - min2)
rows = max2 - min2
width = 0
for i in range(0, len(series)):
width = max(width, len(series[i]))
width += offset
placeholder = cfg.get('format', '{:8.2f} ')
result = [[' '] * width for i in range(rows + 1)]
# axis and labels
for y in range(min2, max2 + 1):
label = placeholder.format(maximum - ((y - min2) * interval / (rows if rows else 1)))
result[y - min2][max(offset - len(label), 0)] = label
result[y - min2][offset - 1] = symbols[0] if y == 0 else symbols[1] # zero tick mark
# first value is a tick mark across the y-axis
d0 = series[0][0]
if _isnum(d0):
result[rows - scaled(d0)][offset - 1] = symbols[0]
for i in range(0, len(series)):
color = colors[i % len(colors)]
# plot the line
for x in range(0, len(series[i]) - 1):
d0 = series[i][x + 0]
d1 = series[i][x + 1]
if isnan(d0) and isnan(d1):
continue
if isnan(d0) and _isnum(d1):
result[rows - scaled(d1)][x + offset] = colored(symbols[2], color)
continue
if _isnum(d0) and isnan(d1):
result[rows - scaled(d0)][x + offset] = colored(symbols[3], color)
continue
y0 = scaled(d0)
y1 = scaled(d1)
if y0 == y1:
result[rows - y0][x + offset] = colored(symbols[4], color)
continue
result[rows - y1][x + offset] = colored(symbols[5], color) if y0 > y1 else colored(symbols[6], color)
result[rows - y0][x + offset] = colored(symbols[7], color) if y0 > y1 else colored(symbols[8], color)
start = min(y0, y1) + 1
end = max(y0, y1)
for y in range(start, end):
result[rows - y][x + offset] = colored(symbols[9], color)
#return '\n'.join([''.join(row).rstrip() for row in result])
print(f"{chr(10).join([''.join(row).rstrip() for row in result])}")
# whipe lines
for i in range(-1,len(result)): # plus -1 to scroll plot to the top or 0 to keep plot at position
print('\033[1A', end='\x1b[2K')
from math import cos
from math import sin
from math import pi
import time
x = []; a = []; b = []; c = []
i = 1
width = 90
while True:
time.sleep(0.05)
a.append(7 * round(sin(i * ((pi * 4) / width)), 2))
b.append(7 * round(cos(i * ((pi * 4) / width)), 2))
c.append(7 * round(-sin(i * ((pi * 4) / width)), 2))
i += 1
if len(a) >= 200: # x aspect
a.pop(0); b.pop(0); c.pop(0)
plot([a, b, c], {'min': -8, 'max': 8, 'height': 30, 'format': '{:8.0f}', 'colors': [blue, lightcyan, lightmagenta]} )but for bigger scales it starts blinking. this is about the limit for me1080/300aspectbig.movyour implementation with blessed is way nicer though
Originally posted by @kroitor in #3 (comment) anyways just thought I leave this here as a simple way for live plots or scrolling plots. perhaps someone has tips to make this better |
|
I don't understand what the problem is here. I just clear the terminal with Nice one amigo, love it 💯 It certainly needs the ability to set label height (perhaps width too) to avoid those tricks I'm doing, import asciichart from 'asciichart'
// Max Y-axis value you expect.
// I'll plot numbers between 1-30, so 100 looks good for me
let MAX_Y = 100
let MARGIN_FACTOR = 1.3 // a bit of margin
let UPDATE_MILLIS = 100 // how often to redraw
// plot MAX_Y first; tricks it into zooming
// out to something more reasonable so you dont
// french kiss ur monitor
let points = [MAX_Y]
setInterval(() => {
// Restart all over again, we ran out of window width
if (points.length > Math.floor((process.stdout.columns / MARGIN_FACTOR)))
points = [MAX_Y] // same trick as above
// Just plot a linearly increasin random float
points.push(Math.random() * points.length)
// Clear window
console.clear()
// Redraw
console.log (asciichart.plot([points], {
offset: 2,
height: process.stdout.rows / MARGIN_FACTOR,
colors: [asciichart.green]
}))
}, UPDATE_MILLIS)
|

Hi man,
This is an awesome lib! I'm wondering if you could give some hints as to how you made the live-updating example work (looking to do it in python).
The text was updated successfully, but these errors were encountered: