-
|
Hello. I haven't change anything in the code and all other examples are working fine. Any help with that will be appreciated. Kind regards, |
Beta Was this translation helpful? Give feedback.
Replies: 4 comments
-
|
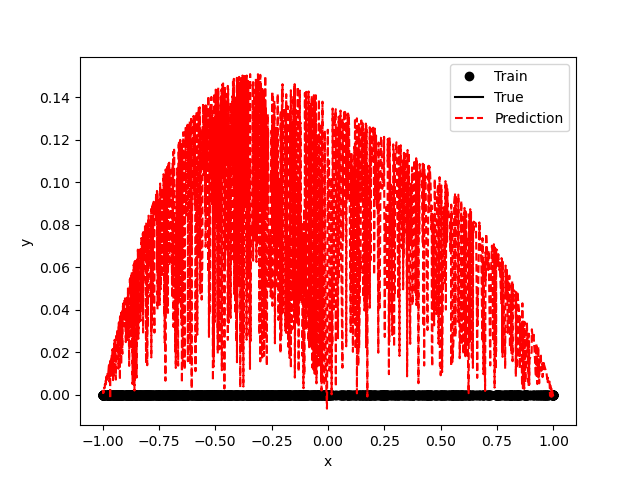
The plot generated from the code is a projection of 2D plot to 1D. The solution is saved in the dumped file |
Beta Was this translation helpful? Give feedback.
-
|
I have the same question. Is there a simple way to convert the solution in test.dat to Fig 7? Note that this is the only 2D example, so it would be very helpful if you can provide a simple visualization script. I would guess x is used to represent points in the L-shape domain through some "distribution" way. Another question: in test.dat, the raw output is "x, y_true, y_pred, y_std", which I got y_pred=0. Did I get wrong solutions? Thanks a lot for the help! |
Beta Was this translation helpful? Give feedback.
-
|
The Fig. 7 was plotted in Matlab by importing test.dat. I will try to provide a Python script. In test.dat, the first column is x coordinate, the second column is y coordinate, the 3rd column is y_true (but here we don't have y_true, and thus is set as 0), the 4th column is y_pred. |
Beta Was this translation helpful? Give feedback.
-
|
Thanks. I think I understand what you did now. Yes, I can reproduce your results now. Greatly appreciate it! |
Beta Was this translation helpful? Give feedback.
The Fig. 7 was plotted in Matlab by importing test.dat. I will try to provide a Python script.
In test.dat, the first column is x coordinate, the second column is y coordinate, the 3rd column is y_true (but here we don't have y_true, and thus is set as 0), the 4th column is y_pred.