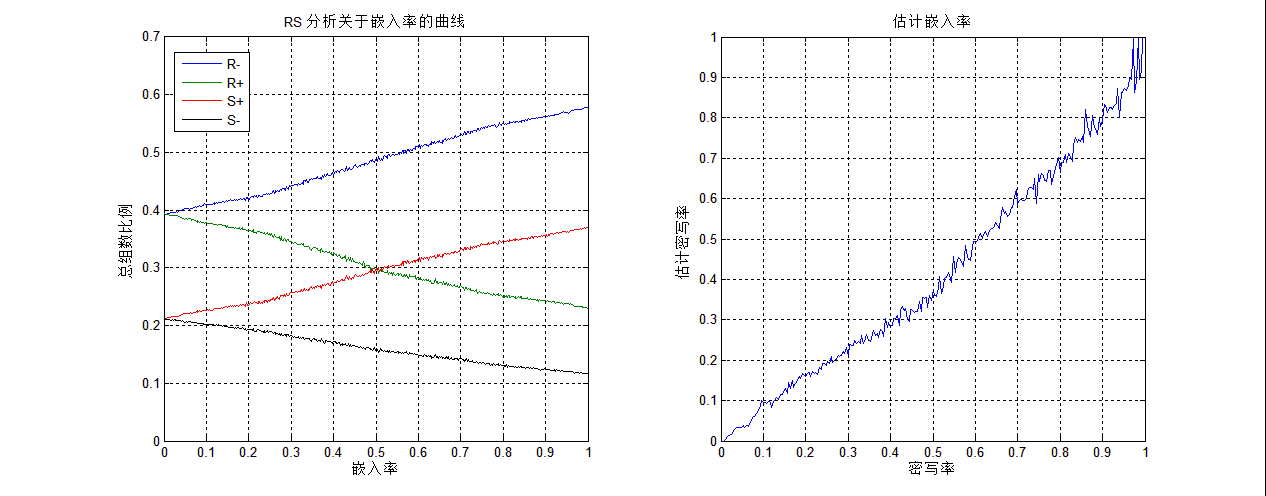
This is a Matlab program for steganalysis, It can draw the plot to show the relationship between embed rate and RS value.
Start the it with compute_plot, and you may need to specific the image name and the increase step of the embed rate.