Home
ObsPyck is a GUI application that is intended to cover the tasks in a standard analysis workflow for seismic events in seismological observatory practice. To achieve this ObsPyck heavily relies on several ObsPy modules.
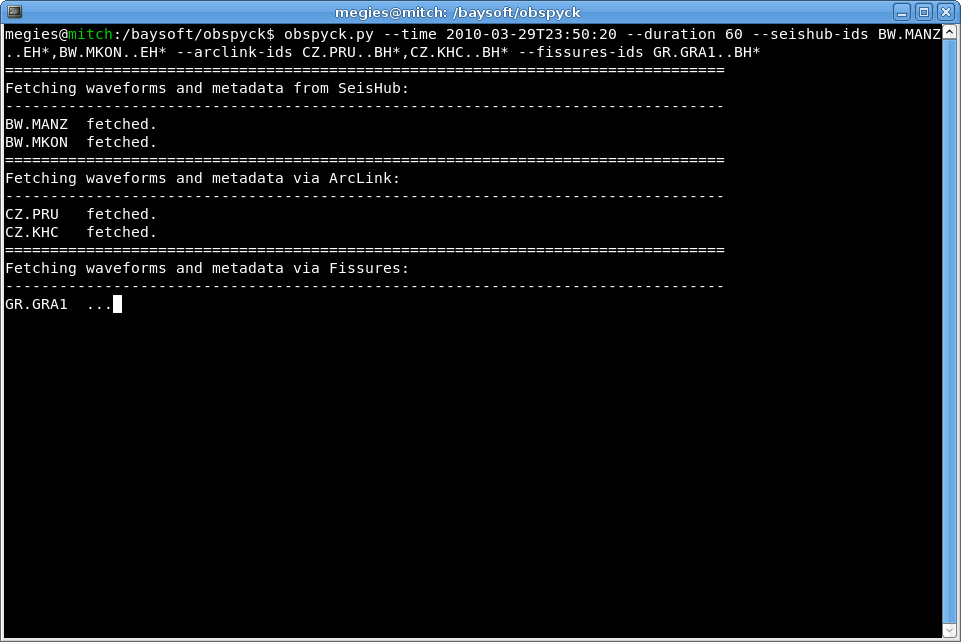
ObsPyck can connect to different servers (FDSNWS, ArcLink, Seedlink, SeisHub, local SDS directory tree), automatically fetches waveforms and metadata (instrument responses, station coordinates) for given time span and network/station IDs and shows all fetched data in a fully interactive screen. Waveform data can also be visualized in form of spectrograms. There is also support for local files (all file formats recognized by ObsPy, metadata has to be supplied in either StationXML or Dataless SEED/XSEED).
ObsPyck can then be used to set P and S wave picks (or custom defined phases) as well as set amplitude maxima/minima for magnitude estimation. These pick data can then be used to run various external programs (e.g. Hypo Inverse 2000, NLLoc, FocMec) that are addressed via system calls. Local magnitudes are calculated using ObsPy (including instrument corrections with fetched response information). The resulting event location and additional information is displayed together with station magnitudes and locations and in an interactive map.
Finally the event results can be saved locally to a QuakeML file and also uploaded if connected to a SeisHub or Jane server.
Recommended installation on Linux and OSX is via Anaconda. Install Anaconda first, following their instructions (only needed if you do not have an Anaconda installation already, of course). Then add the conda-forge channel and install obspyck. Using a dedicated environment specifically for obspy is strongly recommended:
$ conda config --add channels conda-forge
$ conda create -n obspyck python=2.7 obspyck
Fetching package metadata .............
Solving package specifications: .

Package plan for installation in environment /home/megies/anaconda/envs/obspyck:

The following NEW packages will be INSTALLED:

    asn1crypto:         0.22.0-py27_0      conda-forge
    backports_abc:      0.5-py27_0         conda-forge
    ca-certificates:    2017.7.27.1-0      conda-forge
[...]
    numpy:              1.13.1-py27_0
    obspy:              1.1.0-py27_1       conda-forge
    obspyck:            0.5.0-py27_0       conda-forge
[...]

Proceed ([y]/n)? y

#
# To activate this environment, use:
# > source activate obspyck
#
# To deactivate an active environment, use:
# > source deactivate
#
Alternatively, releases are also available on pypi and can be installed using pip.
To run obspyck, simply activate that environment you created earlier and run obspyck:
$ source activate obspyck
(obspyck) $ obspyck
Make sure that you are ‘inside’ your Anaconda Obspy development environment.
(obspyck) $ obspyck -t <starttime> [-config <config file>] [-s <station combinations>] [-d <time length of window>] [local waveform files] [local station metadata files (e.g. StationXML)] [...]Notes:
-
obspyck -hdisplays usage details - Waveform files are a space-delimited set of filenames and paths. These files can be any Obspy-readable format – e.g. SAC, miniSEED, GCF. Can also be a single multiplexed miniSEED file.
- Station metadata can be specified as StationXML and/or Dataless SEED files containing metadata for stations to be analysed needs to be provided so station locations can be determined (and instrument response correction, if required). Only needed for local waveform files. When fetching data from servers / data centers, metadata are automatically fetched together with the waveforms.
- Time start in the typical obspy UTCDateTime object format: yyyy-mm-ddThh:mm:ss
- -d in seconds (optional). Default is defined in the config file.
- Config file: path and filename. Example is given in the Obspyck installation directory Obspyck/Obspyck/example.cfg. By default uses
~/.obspyckrcwhich gets created from example config if not already present.
- Need to make a directory for location of Obspyck plugins (e.g. Hypoinverse, Nonlinloc, Focmec) - directory name is defined in the .cfg file – ‘pluginpath’
- In the plug-in directory, you need the following: crustal velocity model (e.g. .crh); HypoInverse control file (e.g. .inp); hypoInverse binary executable file (see below)
- Binary executable: source code available from ftp://ehzftp.wr.usgs.gov/klein/hyp1.40/; pre-compiled Linux version from http://faldersons.net/Software/Hypoinverse/Hypoinverse.html; Linux binary should be named “hyp2000__Linux__64bit” for Linux 64-bit or “hyp2000__Darwin__64bit” for Mac OSX
- Hypoinverse working files are stored in temp directory determined by Python (normally /var/)
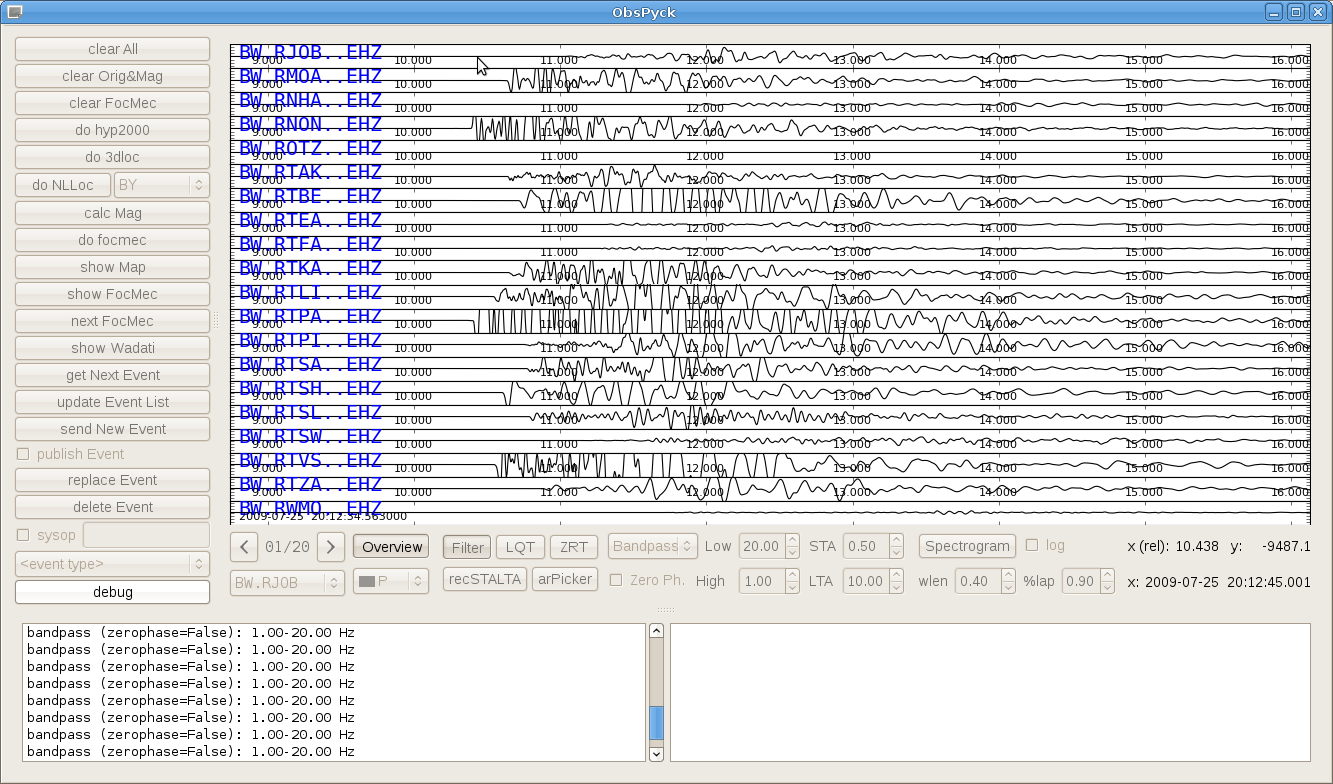
Clicking 'Overview' plots the Z trace of every stream.
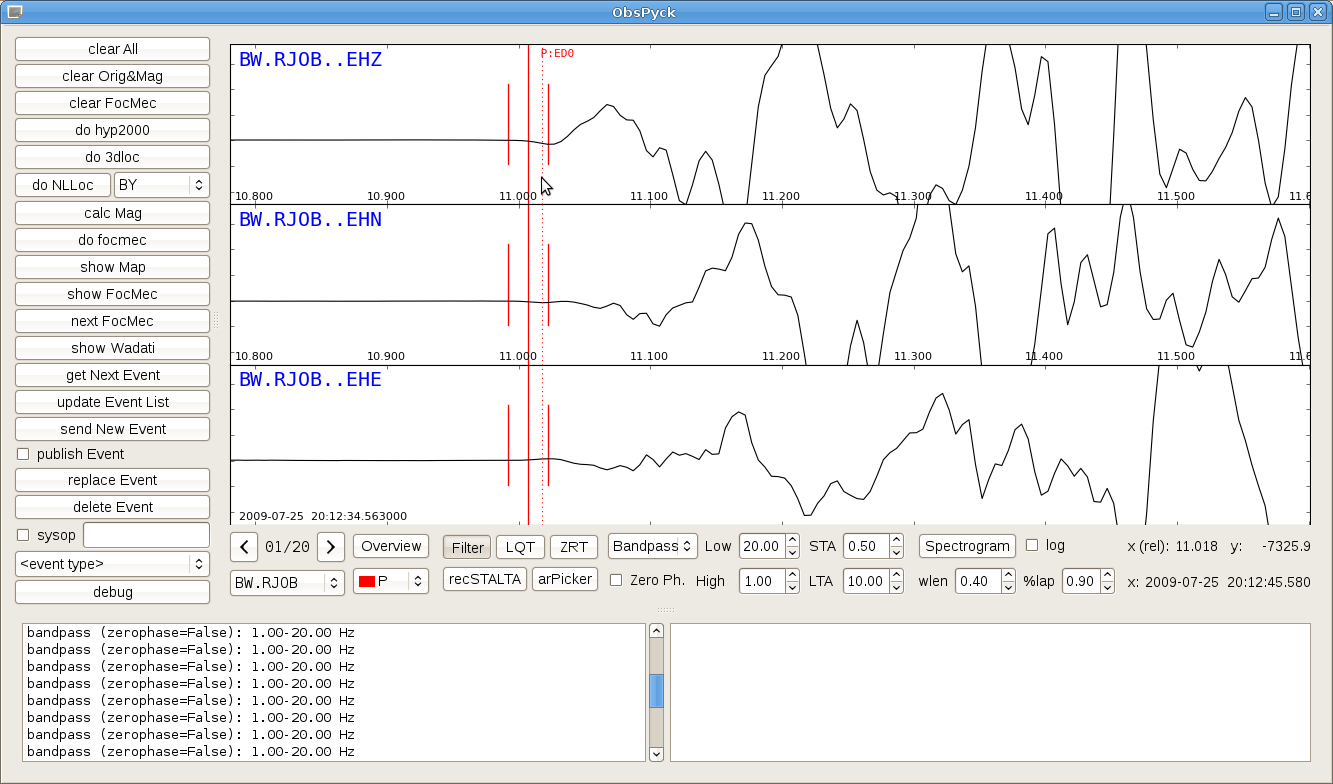
After zooming in using the mouse wheel (shift + mouse wheel to zoom amplitude) picks can be set using the mouse buttons (or at the mouse position with user-defined keys).
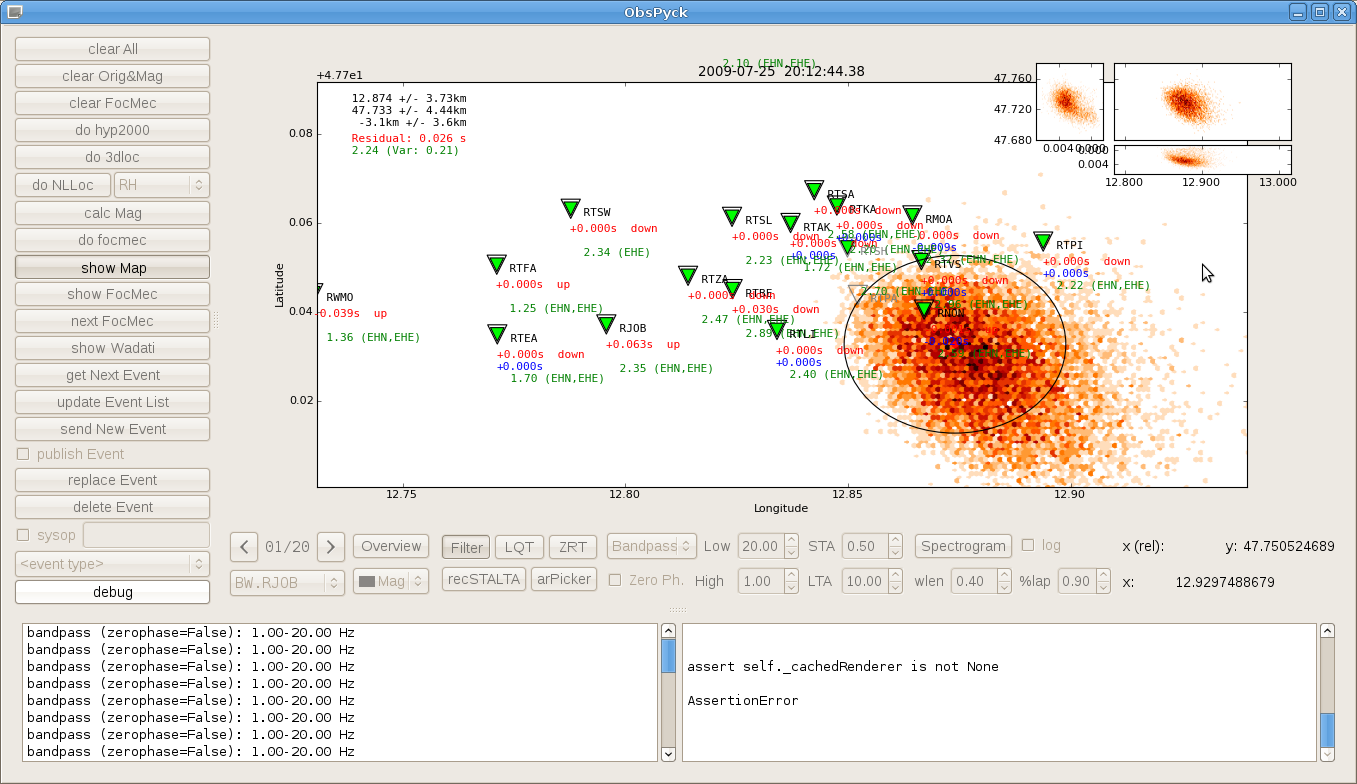
After setting all picks the external location algorithm can be run e.g. by clicking 'do NLLoc'. The event location and information on residuals and magnitudes are displayed in an interactively zoomable map.
After locating, the synthetic picks from the residuals are shown in the stream view. This enables convenient refining of picks.

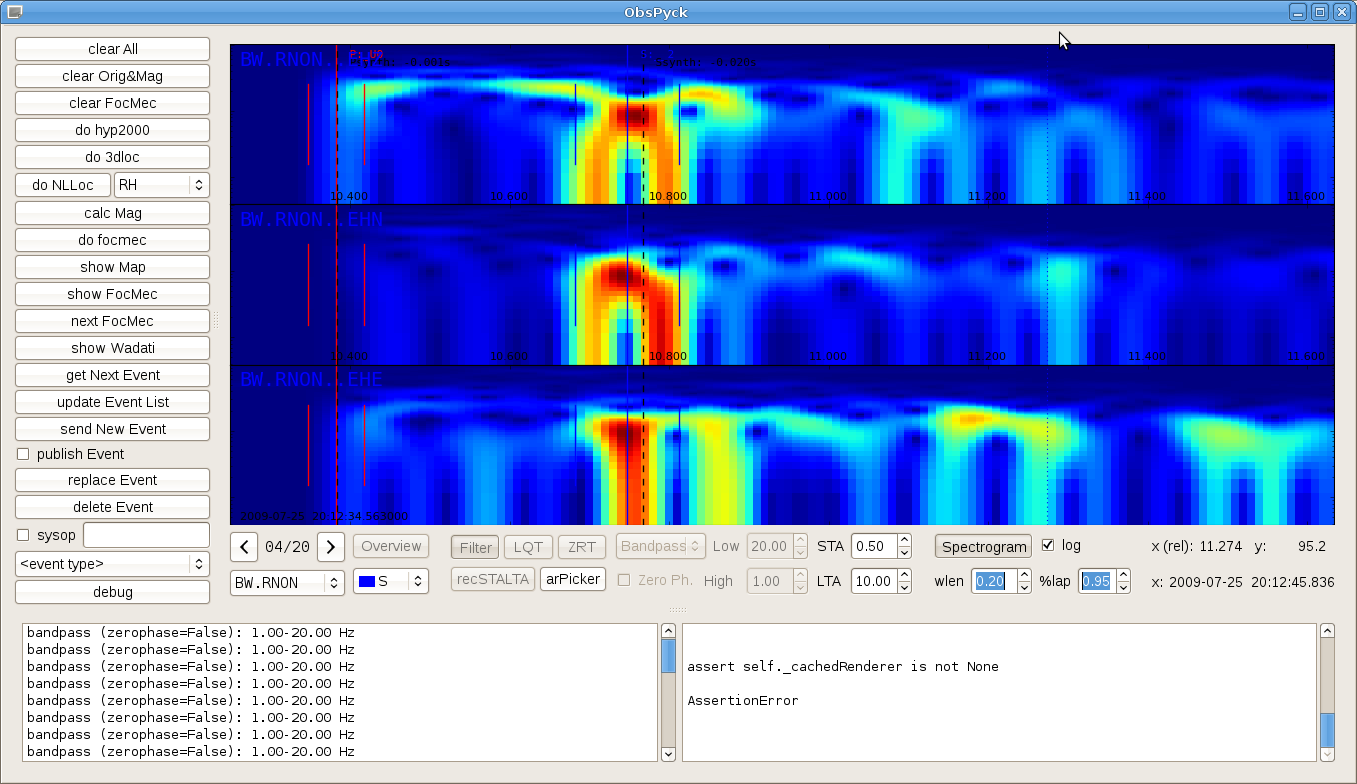
Waveform data can also be visualized in form of spectrograms.
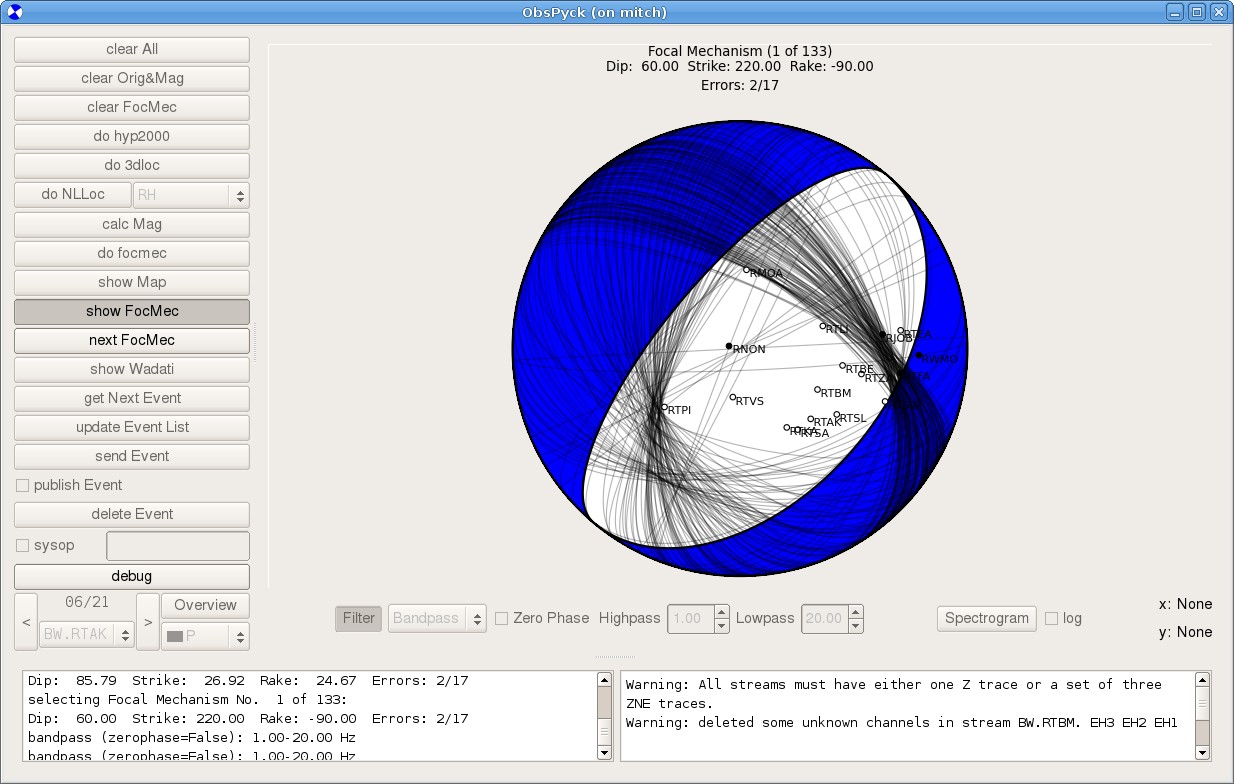
Focal mechanisms determined by FocMec can be visualized indicating alternative solutions.
A Wadati diagram can be plotted to estimate local Vp/Vs ratios.

At the moment ObsPyck is tested on Linux and Mac.
The debugging mode allows access to all internal variables and data.

- Python (2.7)
- ObsPy (>= 1.1.0)
- matplotlib
- Qt and PyQt (both >= 4.4 and < 5)