-
Notifications
You must be signed in to change notification settings - Fork 0
/
Copy pathpresentation_meta_analyses.qmd
245 lines (171 loc) · 6.27 KB
/
presentation_meta_analyses.qmd
1
2
3
4
5
6
7
8
9
10
11
12
13
14
15
16
17
18
19
20
21
22
23
24
25
26
27
28
29
30
31
32
33
34
35
36
37
38
39
40
41
42
43
44
45
46
47
48
49
50
51
52
53
54
55
56
57
58
59
60
61
62
63
64
65
66
67
68
69
70
71
72
73
74
75
76
77
78
79
80
81
82
83
84
85
86
87
88
89
90
91
92
93
94
95
96
97
98
99
100
101
102
103
104
105
106
107
108
109
110
111
112
113
114
115
116
117
118
119
120
121
122
123
124
125
126
127
128
129
130
131
132
133
134
135
136
137
138
139
140
141
142
143
144
145
146
147
148
149
150
151
152
153
154
155
156
157
158
159
160
161
162
163
164
165
166
167
168
169
170
171
172
173
174
175
176
177
178
179
180
181
182
183
184
185
186
187
188
189
190
191
192
193
194
195
196
197
198
199
200
201
202
203
204
205
206
207
208
209
210
211
212
213
214
215
216
217
218
219
220
221
222
223
224
225
226
227
228
229
230
231
232
233
234
235
236
237
238
239
240
241
242
---
title: "Meta-analysis of non-occupational physical activity and cardiovascular disease, cancer and mortality outcomes"
subtitle: Short URL = https://t.ly/z5SO
author: "Ali Abbas"
date: 05/05/2023
date-format: long
institute: MRC-Epidemiology Unit, University of Cambridge
format:
revealjs:
embed-resources: true
slide-number: c/t #< collapsed/total
logo: "img/4261_UKRI_MRC_EU Cambridge_RGB.svg" #https://www.mrc-epid.cam.ac.uk/wp-content/uploads/2021/10/colour-epi-logo.png"
css: ["theme/theme.css"]
theme: [serif, theme/custom.scss]
incremental: true
width: 1920
height: 1080
header: Access the presentation by using https://t.ly/z5SO
editor: visual
filters:
- reveal-header
execute:
size: "huge"
---
# Structure
## Agenda
- Meta-Analysis
- Physical Activity (PA) and its relationship with diseases/mortality
- Outcomes of interest
- Interactive Interface
- Code to access the dose-response curves
# Meta-Analysis
## What is meta-analysis?
::: columns
::: {.column width="60%"}
- Statistical technique for combining data from multiple studies on a particular topic.
- Synthesizing evidence and summarizing the results of individual studies
:::
::: {.column width="40%"}
[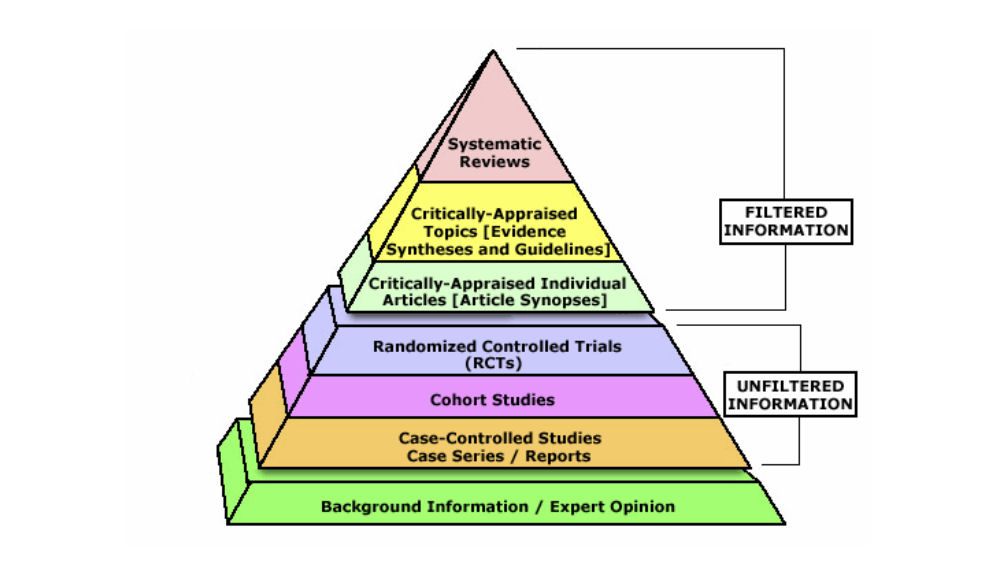](https://s4be.cochrane.org/blog/2014/04/29/the-evidence-based-medicine-pyramid/)
:::
:::
::: footer
<https://uk.cochrane.org/news/meta-analysis-what-why-and-how>
:::
## Diseases and PA
- Globally
- Cardiovascular diseases cause 17.9 million deaths per year in 2019
- Cancers are responsible for 9.6 million deaths in 2017
- Physical Activity is known to reduce the risk of cardiovascular diseases, cancers and early deaths
## Physical Activity Meta-Analysis
- The shape of the dose-response curves has not been established for a range of chronic diseases (@garcia2023non)
- Key finding: 1 in 10 premature deaths can be avoided if everyone achieves 75 minutes of vigorous-intensity activity a week
- Higher level of PA is associated with lower risk of all outcomes [](https://bjsm.bmj.com/content/early/2023/01/23/bjsports-2022-105669)
## Eligibility Criteria
- Prospective cohort studies with general population samples of greater than 10K adults
- 3 or more physical activity categories
- Risk measures and Confidence Interval (CIs) for host of measures/disease end points
## Studies
- 196 studies
- 94 cohorts
- `>` 30 Million participants
# Interactive Interface
## Outcomes - overall
::: footer
<https://shiny.mrc-epid.cam.ac.uk/meta-analyses-physical-activity/>
:::

## Outcomes - Level 1
::: footer
<https://shiny.mrc-epid.cam.ac.uk/meta-analyses-physical-activity/>
:::

## Outcomes - Level 2
::: footer
<https://shiny.mrc-epid.cam.ac.uk/meta-analyses-physical-activity/>
:::

## Outcomes - Level 3
::: footer
<https://shiny.mrc-epid.cam.ac.uk/meta-analyses-physical-activity/>
:::

## Outcome category and type
::: footer
<https://shiny.mrc-epid.cam.ac.uk/meta-analyses-physical-activity/>
:::
| | |
|---------------------------------|---------------------------------------|
|  |  |
## Meta-analysis and dose-range
::: footer
<https://shiny.mrc-epid.cam.ac.uk/meta-analyses-physical-activity/>
:::
| |
|-----------------------------------|
| {width="590"} |
| {width="590"} |
## Dose distribution and Potential Impact Fraction (PIF)
::: footer
<https://shiny.mrc-epid.cam.ac.uk/meta-analyses-physical-activity/>
:::
| | |
|--------------------------------------|-------------------|
| {width="812"} |  |
# Code
## R Package {auto-animate="true"}
::: footer
<https://meta-analyses.github.io/drpa/drpa.html>
:::
- An R package called `dose-response physical activity (drpa)` is created
- It is open source and hosted on GitHub
- You may need to install it used `remotes::install_github("meta-analyses/drpa")`
. . .
``` r
# Specify the cause, outcome_type and the dose
rr <- drpa::dose_response(cause = cause_name,
outcome_type = outcome_type,
dose = float)
```
## R Package use {auto-animate="true"}
::: footer
<https://meta-analyses.github.io/drpa/drpa.html>
:::
::: nonincremental
- An R package called `dose-response physical activity` is created
- It is open source and hosted on GitHub . . .
- You may need to install it used `remotes::install_github("meta-analyses/drpa")`
:::
. . .
``` r
# Specify the cause, outcome_type, dose and the confidence interval
rr <- drpa::dose_response(cause = "all-cause-mortality",
outcome_type = "fatal",
dose = 40,
confidence_interval = TRUE)
```
. . .
```{r, echo=FALSE}
#| tbl-cap: "Cars"
#| tbl-colwidths: [60,40]
#| tbl-cap-location: margin
rr <- drpa::dose_response(cause = "all-cause-mortality",
outcome_type = "fatal",
dose = 15,
confidence_interval = TRUE)
names(rr) <- c("Relative Risk", "Lower Bound", "Upper Bound")
library(knitr)
knitr::kable(rr, align = "lccrr", caption = "An example output", digits = 2)
```
## R Package arguments {auto-animate="true"}
::: footer
<https://meta-analyses.github.io/drpa/drpa.html>
:::
[](https://meta-analyses.github.io/drpa/drpa.html)
# Lookup tables
# Download from the Interactive Interface

::: footer
<https://shiny.mrc-epid.cam.ac.uk/meta-analyses-physical-activity/>
:::
# Lookup on GitHub repo

::: footer
<https://github.com/meta-analyses/drpa/tree/master/inst/extdata>
:::
# Lookup on GitHub repo for All-cause-mortality

::: footer
<https://github.com/meta-analyses/drpa/blob/master/inst/extdata/all-cause-mortality-fatal.csv>
:::