An implementation and backtest analysis of VOBHS algorithmic trading strategy using NumPy, Pandas and Backtesting using Backtesting.py
The original video for this trading strategy using manual indicators on tradingview was found on this youtube video, claiming to be a highly profitable strategy. The complete strategy has been implemented on python recreating the indicators and automating the strategy.
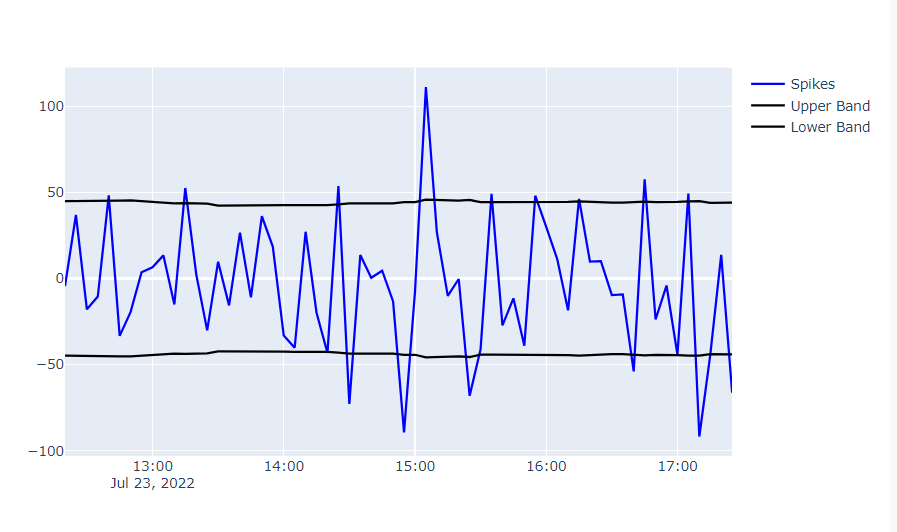
Volatility-Oscillator Technical Strategy that analyzes the volume and current market trend to filter buy and sell signals algorithmically. The strategy comprises of the following indicators:
Volatility-Oscillator

Boom-Hunter Pro (Pinescript to Python implementation)

Hull-Moving Average

Modified Average True range for Stop Loss
Price movement follows a regular and consistent pattern where it will gradually decline before accelerating and bottoming out. Similar to how the price will frequently increase gradually before accelerating into a peak.
No matter the type of market being traded or the trading strategy being employed, it is important to distinguish between moderate, steady price movements and more extreme, accelerated price movements. These accelerated price movements are related to exceptional market circumstances, which call for a trader to be alert and organized. A Volatility Oscillator can also take advantage of accelerated price movements by giving additional confirmation on actual trend happening on market.
Study on Volatility Oscillator
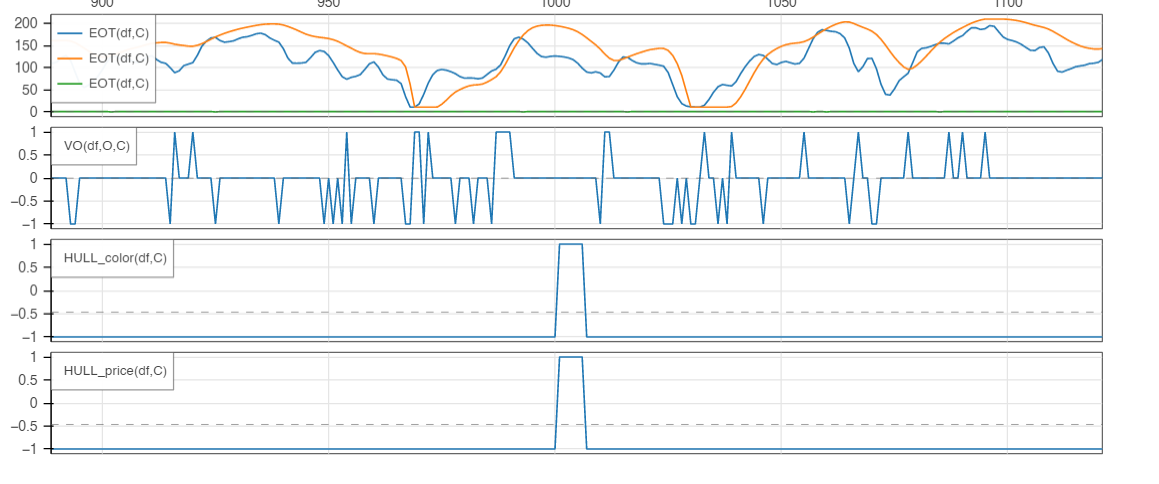
The original Boom-pro indicator by Veryfid in pinescript language reverse engineered and implemented on Python.
Note: Only certain segments of the complete Boom indicator modified for VOBHS strategy has been implemented here.
Study on Boom Hunter Pro
The Hull Moving Average (HMA) seeks to maintain the smoothness of the moving average line while reducing the lag of a conventional moving average. This indicator, created by Alan Hull in 2005, prioritizes more recent values and significantly reduces lag by using weighted moving averages.
Study on Hull MA
Start                                     0.0
End                                    1499.0
Duration                               1499.0
Exposure Time [%]                        31.4
Equity Final [$]                   10131.9031
Equity Peak [$]                    10131.9031
Return [%]                           1.319031
Buy & Hold Return [%]                0.952299
Return (Ann.) [%]                         0.0
Volatility (Ann.) [%]                     NaN
Sharpe Ratio                              NaN
Sortino Ratio                             NaN
Calmar Ratio                              0.0
Max. Drawdown [%]                   -2.007586
Avg. Drawdown [%]                   -1.720264
Max. Drawdown Duration                  317.0
Avg. Drawdown Duration                  234.5
# Trades                                  1.0
Win Rate [%]                            100.0
Best Trade [%]                       1.446258
Worst Trade [%]                      1.446258
Avg. Trade [%]                       1.446258
Max. Trade Duration                     470.0
Avg. Trade Duration                     470.0
Profit Factor                             NaN
Expectancy [%]                       1.446258
SQN                                       NaN
_strategy                      Vobhs_Strategy
_equity_curve                       Equity...
_trades                      Size  EntryBa...
dtype: object
The results although profitable on back test has been proved unprofitable due to broker fees and changing market conditions. The goal of VOBHS project is just for demonstrative and educational purposes only
The material on this repository and the analysis has no regard to the specific investment objectives, financial situation, or particular needs of any user. This website is presented solely for informational and entertainment purposes and is not to be construed as a recommendation, solicitation, or an offer to buy or sell / long or short any securities, commodities, cryptocurrencies, or any related financial instruments. Nor should any of its content be taken as investment advice.


