Moving quantiles implemented as fast moving window sort algorithm. Implemented both as functions over a moving window, and stateful filter objects.
Setting an appropriate probability level, you can get: moving median, minimum, maximum, quartiles and so on.
pkg> add SortFiltersThere are two other Julia packages with overlapping functionality for moving quantiles functions:
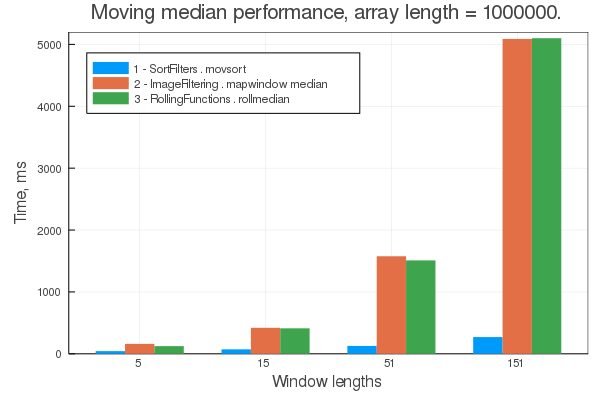
Compared to these packages, SortFilters.jl provides significant speed-up (3x-20x faster), depending on window size (benchmark available at examples/benchmark.jl):
Also SortFilters.jl provides stateful filter objects, allowing you to process a signal of indefinite length in RAM-friendly chunks, similar to DSP.jl.
However, if all you need is moving maximum, minimum, or range, then you should use another package, MaxMinFilters.jl, which implement much faster algorithms than moving sort.
using Plots
using SortFilters
using Random

Random.seed!(5)
len = 200
x = trunc.(Int, 100*randn(len))
x = cumsum(x)
w = 20

# when p represents probability rational number in the range of [0..1]
probability = 0.5
# output is converted to rational type of p
moving_median = movsort(x, w, probability)

# when p represents integer percent number in the range of [0..100]
percent = 50
# output preserves input type and is calculated as simplified quantiles
# from input elements at nearest index
moving_median_int = movsort(x, w, percent)

# also you can get several quantiles at once:
p = (0.25, 0.75)
moving_quartiles = movsort(x, w, p)
# and then calculate interquantile range
moving_iqr = map( x->x[2]-x[1], moving_quartiles)
moving_q25 = map( x->x[1], moving_quartiles)
moving_q75 = map( x->x[2], moving_quartiles)

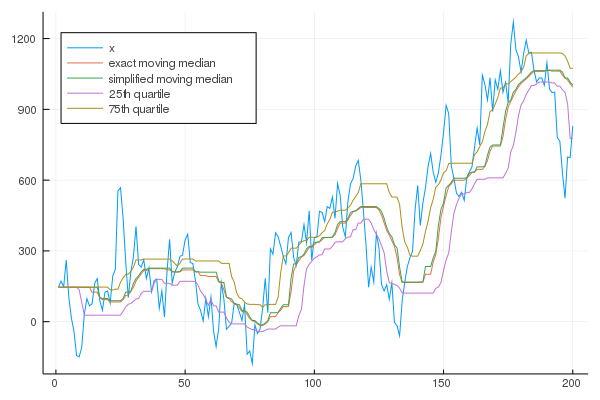
# notice that quantiles are calculated with a delay of window/2
# start boundary condition is set as a repeated first point
plot(x, label = "x", legend = :topleft)
plot!(moving_median, label = "exact moving median")
plot!(moving_median_int, label = "simplified moving median")
plot!(moving_q25, label = "25th quartile")
plot!(moving_q75, label = "75th quartile")

#png("plot1.png")
