You signed in with another tab or window. Reload to refresh your session.You signed out in another tab or window. Reload to refresh your session.You switched accounts on another tab or window. Reload to refresh your session.Dismiss alert
Initial NMDS ordinations and example diversity statistics for metabarcoding data
This workflow and Jupyter binder shows a basic workflow to visualize metabarcoding data in R.
Quick Start:
Click on the binder link, than click "knit" to make an html R Markdown. You may need to turn off your pop up blocker.
Example Output:
Summary:
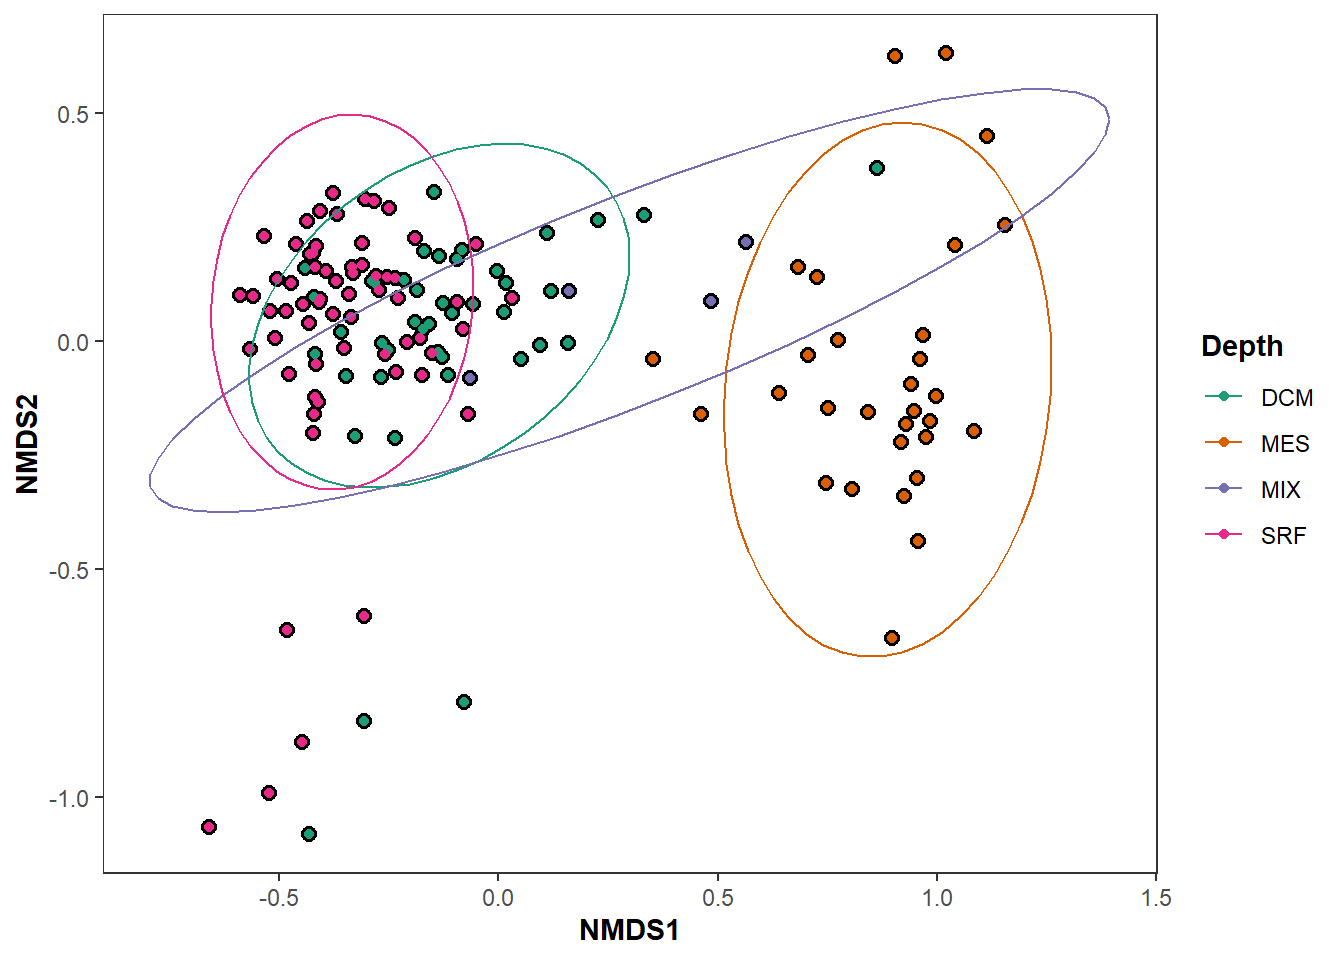
This workflow will generate several example NMDS ordinations from an OTU/ASV table.
Please remove taxonomic assignments before using this workflow.
This plot will provide a visual representation of a given sample’s community composition in relation to all other samples. These plots allow you to quickly visualize your metabarcoding community by any metadata grouping (categorical) factor you choose.
 https://orcid.org/0000-0002-4848-8901