
This back-end Grafana datasource plugin provides a user-friendly grafana experience with only a handful simple and generic parameters to configure. It comes with a dedicated API specification that requires implementation in the data provider's back-end. Implementing this API helps to decouple the front-end visualisation solution from the back-end data-layer implementation, leaving developers with the necessary freedom to update and improve the back-end without breaking the end-user experience.
The protobuf API specification can be found in the pkg/proto directory. On configuring the datasource plugin, the end-user provides an endpoint URL and optionally an API key too. The datasource will attempt to establish a gRPC connection and emit calls to the given endpoint according to the API specification.
For more information on gRPC or protobuf, see the gRPC docs.
gRPC is a fast & efficient framework for inter-service communication and provides a fool-proof and streamlined workflow for API implementation through protobuf.
gRPC also supports all essential streaming capabilities, which can be implemented in future releases.
The datasource plugin establishes a secure gRPC connection through TLS. Additionally, the datasource supports API-key authorization. The API-key will be included in each API call as part of the call metadata.
The variable that is updated with new values as the stream of timeseries datapoints is appended.
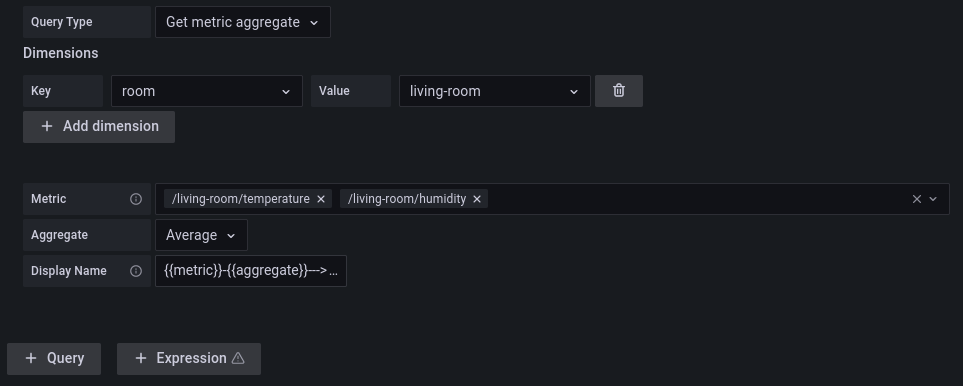
A dimension is an optional, identifying property of the measure. Each dimension is modeled as a key-value pair. A measure can have zero or many dimensions that collectively uniquely identify it.
| type | description |
|---|---|
| Get Metric History | gets historical timeseries values |
| Get Metric Aggregate | gets aggregated timeseries |
| Get Metric Value | gets the last known value |
- start a sample grpc server locally:
docker run -p 50051:50051 innius/sample-grpc-server
-
install the innius-simple-grpc-datasource
-
enable the datasource
- configure the endpoint
localhost:50051
- configure the endpoint
-
configure dashboards
This datasource plugin expects a backend to implement the Simple or the Advanced interface.
The Simple API (GrafanaQueryAPI)
This API provides the following operations:
| name | description |
|---|---|
| ListDimensionKeys | Returns a list of all available dimension keys |
| ListDimensionValues | Returns a list of all available dimension values of a dimension key |
| ListMetrics | Returns a list of all metrics for a combination of dimensions. |
| GetMetricValue | Returns the last known value of a metric. |
| GetMetricHistory | Returns historical values of a metric |
| GetMetricAggregate | Returns aggregated metric values |
A sample implementation can be found here.
This API has some limitations:
- it only supports one metric per query
- it does not support variables with multiple options
- it does not support enhanced metadata for metrics (like unit, etc.)
The Advanced API (GrafanaQueryAPIV2)
This API provides almost the same operations as the Simple API but with one major difference: it supports multiple metrics for the same query. As a result this API integrates seamlessly with grafana templating capabilities. In addition, it supports enhanced metric metadata, like unit of measure. Another difference is that it supports grafana labels.
This API provides the following operations:
| name | description |
|---|---|
| ListDimensionKeys | Returns a list of all available dimension keys |
| ListDimensionValues | Returns a list of all available dimension values of a dimension key |
| ListMetrics | Returns a list of all metrics for a combination of dimensions. |
| GetMetricValue | Returns the last known value for one or more metrics. |
| GetMetricHistory | Returns historical values for one or more metrics |
| GetMetricAggregate | Returns aggregated values for one or more metrics |
A sample implementation can be found here.
- different time series for the same metric with different labels. For example: the temperature measure is a room. The room has four zones: north, south, east and west. The V1 API does not support this unless there are four different metrics defined for each temperature / zone combination.
The V2 API does support this scenario by returning multiple time series for the same metric
temperature, each annotated with different labelzone. - different time series for different metrics. For example: a room has multiple temperature sensors. The V1 API supports this by defining multiple queries for each metric. The V2 API can do this with a single query.
Important Note: in order to use the V2 API the backend server needs to support gRPC Reflection. The plugin uses this to determine if a backend supports the V2 protocol. If V2 is not supported it falls back on the Simple API implementation.
Please note gRPC is programming language agnostic which makes it possible to implement a backend in the language of your choice. Checkout the gRPC documentation of your language.
- add more authentication schemes (certificates, basic authentication etc. )
- support annotations
- support streaming queries