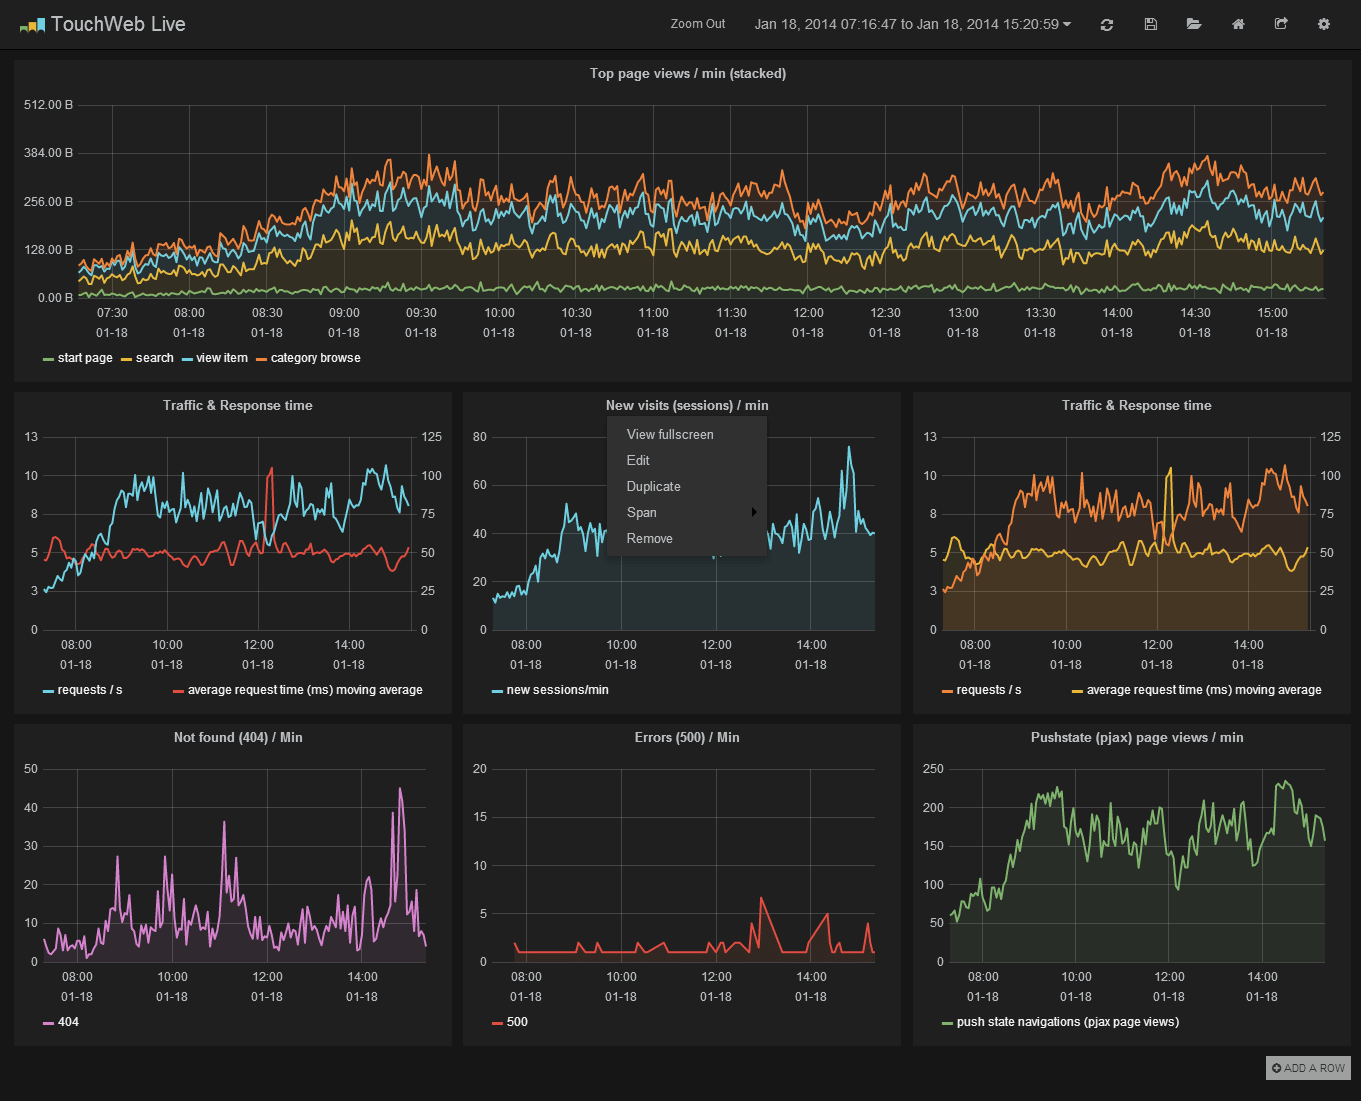
A beautiful, easy to use and feature rich Graphite dashboard replacement and graph editor. Visit grafana.org for screenshots, videos and feature descriptions.
- Graphite target expression parser
- Quickly add / edit / remove function (video demo)
- Function parameters can be easily changed
- Quickly navigate graphite metric structure
- Templating
- Integrated links to function documentation
- Rearrange function order
- Native Graphite PNG render support
- Fast rendering, even over large timespans.
- Click and drag to zoom.
- Multiple Y-axis.
- Bars, Lines, Points.
- Smart Y-axis formating
- Series toggles & color selector
- Axis labels
- Grid thresholds, axis labels
- [Annotations] (https://github.com/grafana/grafana/wiki/Annotations)
- Create and edit dashboards
- Drag and drop graphs to rearrange
- Set column spans and row heights
- Save & search dashboards
- Import & export dashboard (json file)
- Import dashboard from Graphite
- Templating
- Scripted dashboards (generate from js script and url parameters)
- Flexible time range controls
- Dashboard playlists
- Use InfluxDB as metric datasource
Grafana is very easy to install. It is a client side web app with no backend. Any webserver will do. Optionally you will need ElasticSearch if you want to be able to save and load dashboards quickly instead of json files or local storage.
- Download and extract the latest release.
- Rename
config.sample.jstoconfig.js, then changegraphiteUrlandelasticsearchto point to the correct urls. The urls entered here must be reachable by your browser. - Point your browser to the installation.
To run from master:
- Clone this repository
- Start a web server in src folder
- Or create a optimized & minified build:
- npm install (requires nodejs)
- grunt build (requires grunt-cli)
If you use ansible for provisioning and deployment ansible-grafana should get you started.
When you have Grafana up an running, read the Getting started guide for an introduction on how to use Grafana and/or watch this video for a guide in creating a new dashboard and for creating templated dashboards.
If you haven't used an alternative dashboard for graphite before you need to enable cross-domain origin request. For Apache 2.x:
Header set Access-Control-Allow-Origin "*"
Header set Access-Control-Allow-Methods "GET, OPTIONS"
Header set Access-Control-Allow-Headers "origin, authorization, accept"
Note that using "*" leaves your graphite instance quite open so you might want to consider using "http://my.graphite-dom.ain" in place of "*"
If your Graphite web is proteced by basic authentication, you have to enable the HTTP verb OPTIONS, origin (no wildcards are allowed in this case) and add Access-Control-Allow-Credentials. This looks like the following for Apache:
Header set Access-Control-Allow-Origin "http://mygrafana.com:5656"
Header set Access-Control-Allow-Credentials true

<Location />
    AuthName "graphs restricted"
    AuthType Basic
    AuthUserFile /etc/apache2/htpasswd
    <LimitExcept OPTIONS>
      require valid-user
    </LimitExcept>
</Location>
- Improve and refine the target parser and editing
- Improve graphite import feature
- Refine and simplify common tasks
- More panel types (not just graphs)
- Use elasticsearch to search for metrics
- Improve template support
- Annotate graph by querying ElasticSearch for events (or other event sources)
If you have any idea for an improvement or found a bug do not hesitate to open an issue. And if you have time clone this repo and submit a pull request and help me make Grafana the kickass metrics & devops dashboard we all dream about!
Clone repository:
- npm install
- grunt server (starts development web server in src folder)
- grunt (runs jshint and less -> css compilation)
This software is based on the great log dashboard kibana.
Grafana is distributed under Apache 2.0 License.

