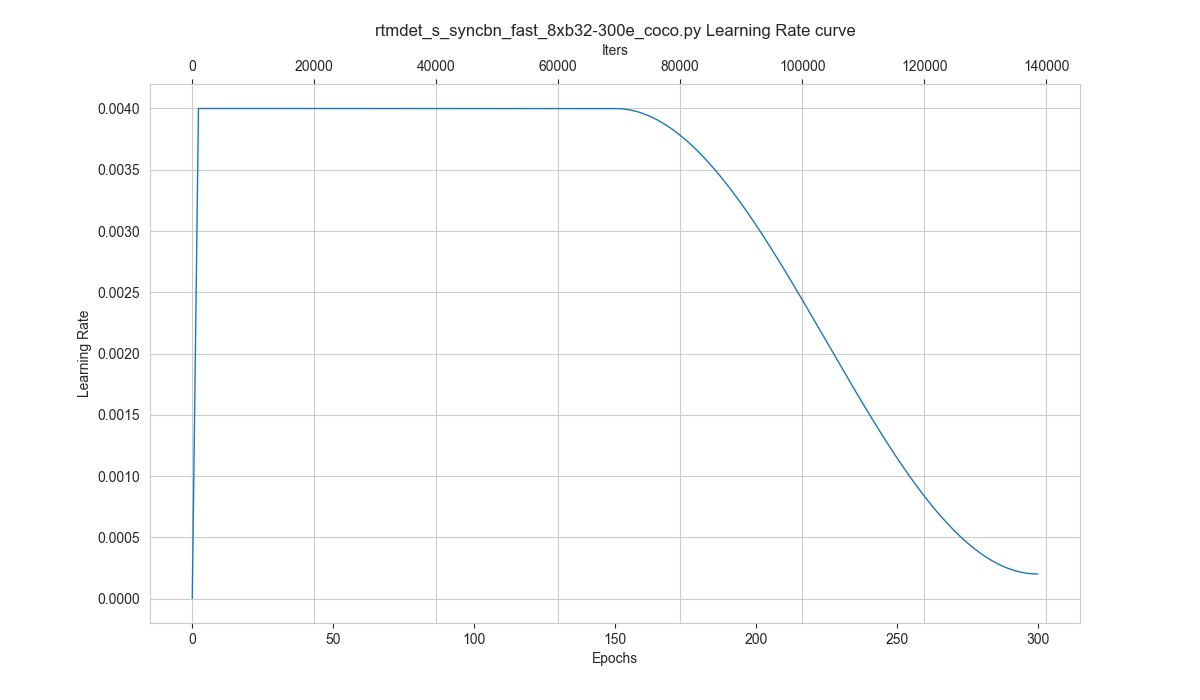
tools/analysis_tools/vis_scheduler aims to help the user to check the hyper-parameter scheduler of the optimizer(without training), which support the "learning rate", "momentum", and "weight_decay".
python tools/analysis_tools/vis_scheduler.py \
    ${CONFIG_FILE} \
    [-p, --parameter ${PARAMETER_NAME}] \
    [-d, --dataset-size ${DATASET_SIZE}] \
    [-n, --ngpus ${NUM_GPUs}] \
    [-o, --out-dir ${OUT_DIR}] \
    [--title ${TITLE}] \
    [--style ${STYLE}] \
    [--window-size ${WINDOW_SIZE}] \
    [--cfg-options]
Description of all arguments:
config: The path of a model config file.-p, --parameter: The param to visualize its change curve, choose from "lr", "momentum" or "wd". Default to use "lr".-d, --dataset-size: The size of the datasets. If set,DATASETS.buildwill be skipped and${DATASET_SIZE}will be used as the size. Default to use the functionDATASETS.build.-n, --ngpus: The number of GPUs used in training, default to be 1.-o, --out-dir: The output path of the curve plot, default not to output.--title: Title of figure. If not set, default to be config file name.--style: Style of plt. If not set, default to bewhitegrid.--window-size: The shape of the display window. If not specified, it will be set to12*7. If used, it must be in the format'W*H'.--cfg-options: Modifications to the configuration file, refer to Learn about Configs.
Loading annotations maybe consume much time, you can directly specify the size of the dataset with `-d, dataset-size` to save time.
You can use the following command to plot the step learning rate schedule used in the config configs/rtmdet/rtmdet_s_syncbn_fast_8xb32-300e_coco.py:
python tools/analysis_tools/vis_scheduler.py \
    configs/rtmdet/rtmdet_s_syncbn_fast_8xb32-300e_coco.py \
    --dataset-size 118287 \
    --ngpus 8 \
    --out-dir ./output