This project started out as a joke of a colleague of mine. He asked another colleague why we do not have a Corona Dashboard for our Grafana.
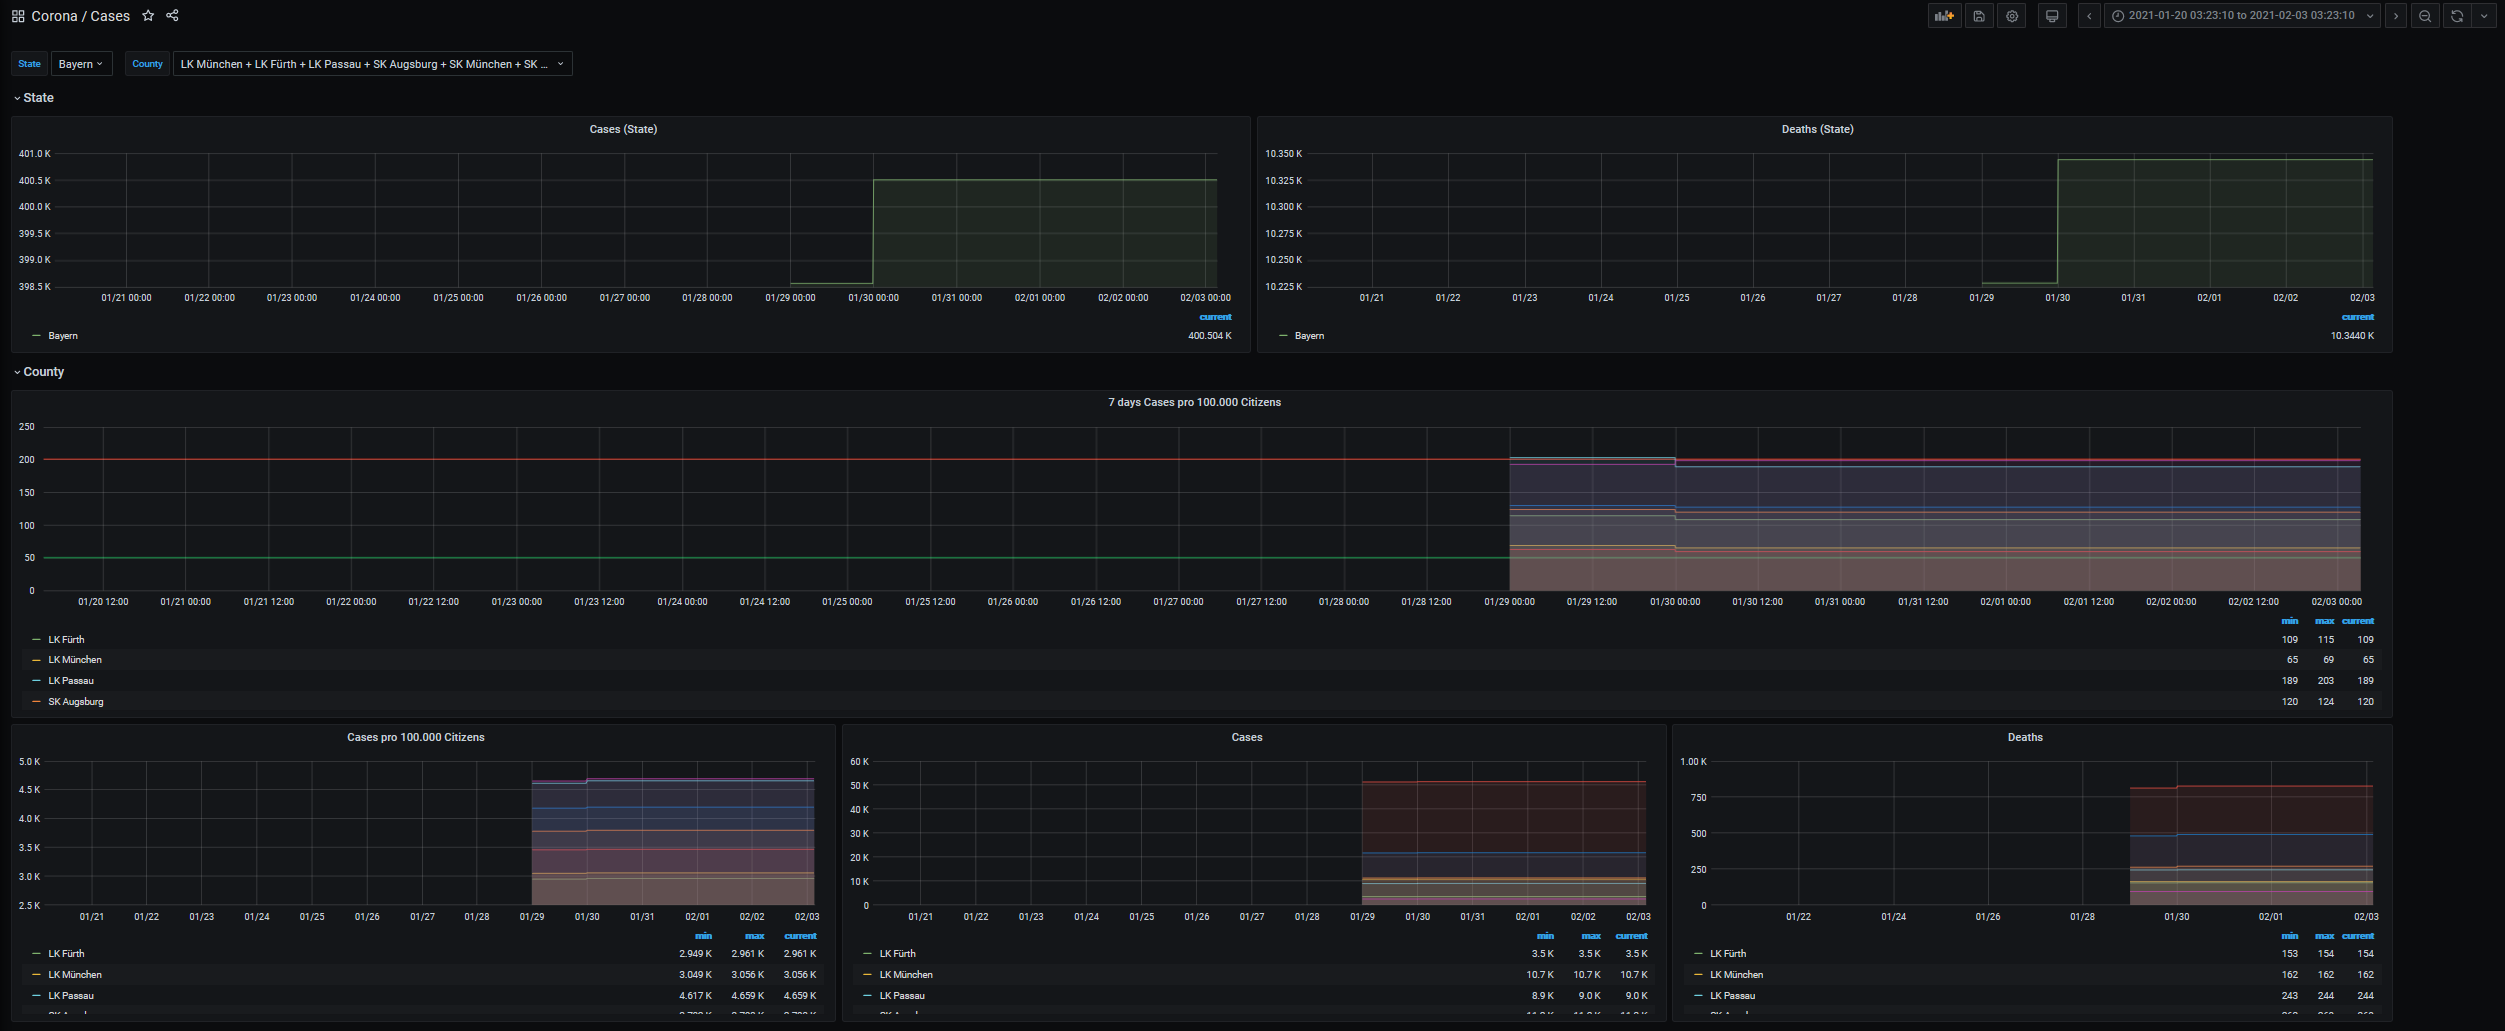
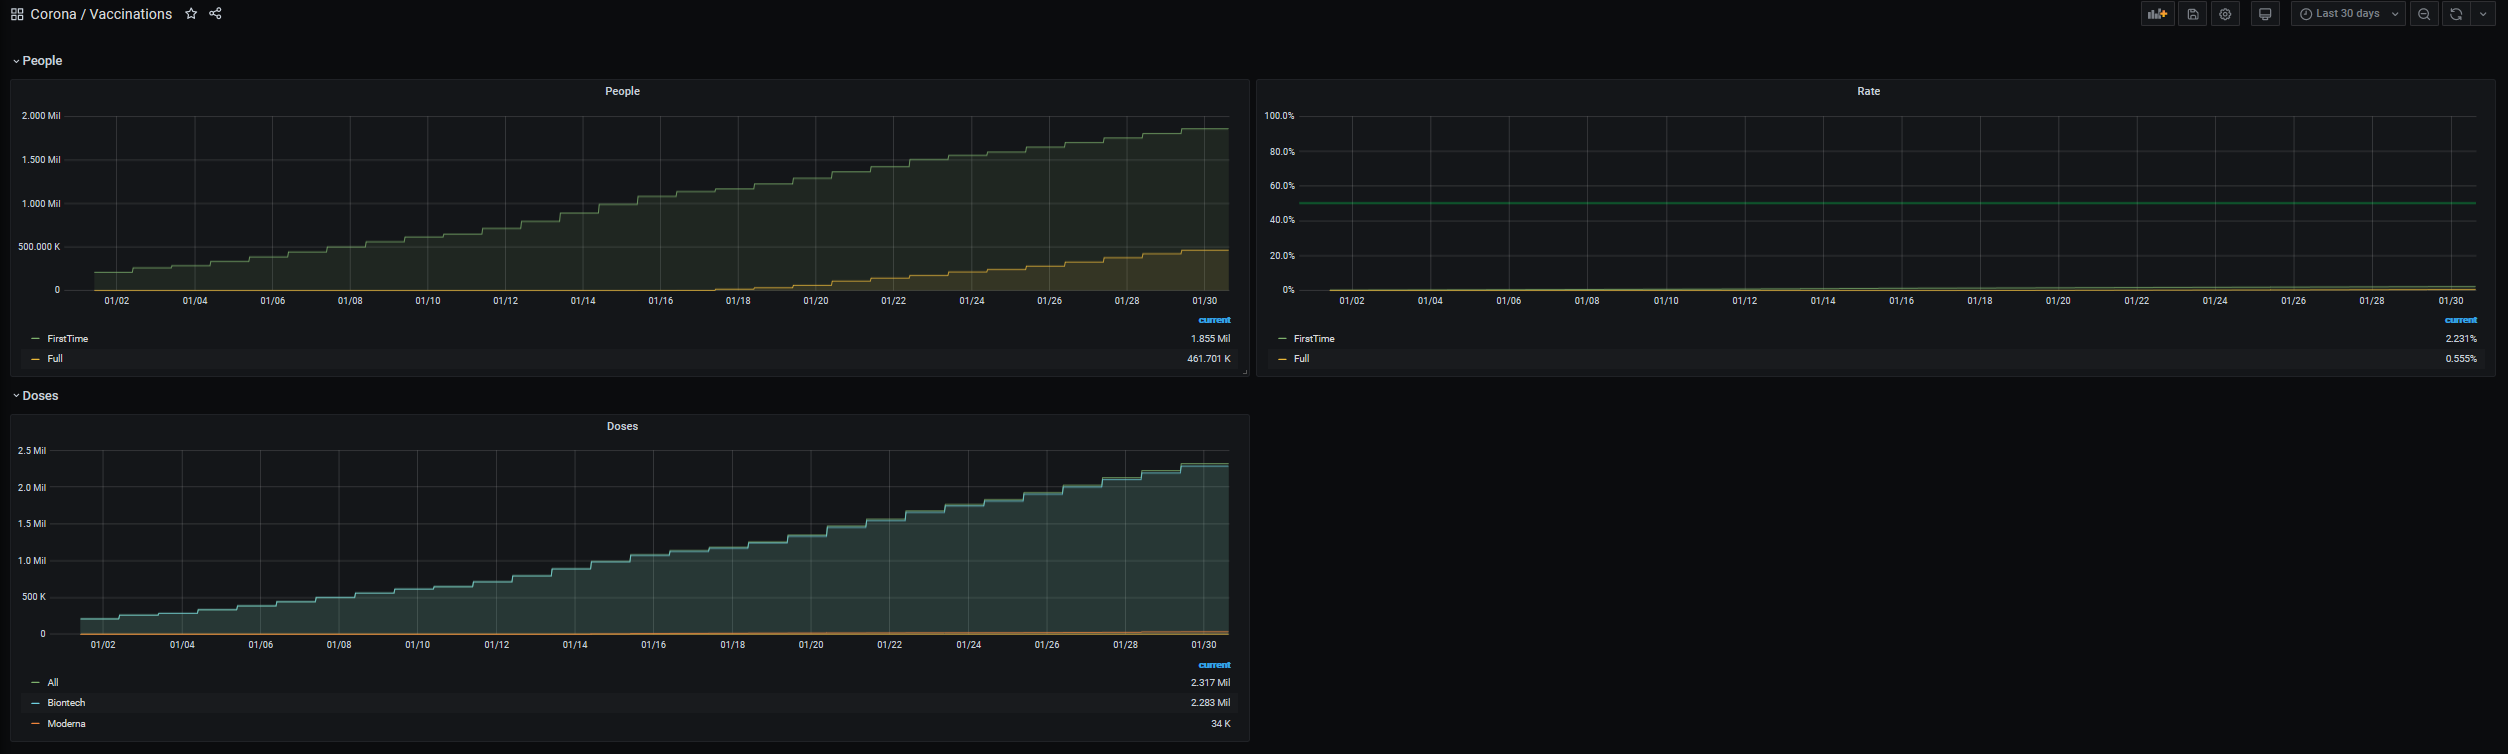
This is my implementation of a Corona Dashboard for Grafana and a microservice based on the official numbers of the German Federal Government. The numbers are provided by the Robert Koch Institute (RKI). The RKI is a German Federal Government agency and research institute responsible for disease control and prevention.
The microservice to pull the data from the RKI API is written in Go and parses the data to get the relevant numbers. After parsing the data the microservice stores them in an InfluxDB database. InfluxDB is a time series database.
You need to have a running instance of Grafana and InfluxDB. Also, it is recommended to have a server where you can deploy the microservice, but it is also possible to start the microservice manually on a local machine.
Download the prebuilt binary packages from the release page and install them on your server.
If you are running a Debian-based Linux Distribution choose the .deb Package for your operating system architecture and download it. You are able to use curl to download the package.
Now you are able to install the package using APT.
sudo apt install ./corona-dashboard-vX.X-.linux.XXXX.deb
After installing the package configure the microservice. The configuration file is located under /etc/corona-dashboard/config.yml.
At this point you are able to enable the Systemd service using systemctl.
sudo systemctl enable corona-dashboard
And start the service also using systemctl.
sudo systemctl start corona-dashboard
When running a RHEL-based Linux Distribution choose the .rpm package for your operating system architecture and download it.
Now you are able to install the package.
sudo dnf install ./corona-dashboard-vX.X-.linux.XXXX.rpm
After installing the package configure the microservice. The configuration file is located under /etc/corona-dashboard/config.yml.
Now you are able to enable the Systemd service using systemctl.
sudo systemctl enable corona-dashboard
And start the service also using systemctl.
sudo systemctl start corona-dashboard
If you plan to run the microservice on Windows or another OS the whole process is a bit more complicated because there is no installation package available only prebuilt binaries.
Download the prebuilt binary for your operating system.
Extract the prebuilt binary and change the configuration file located under config/config.conf.
After successful changing the configuration file you are able to run the prebuilt binary.
The microservice tries to access the configuration file located under /etc/corona-dashboard/config.conf. If the configuration file is not accessible or found the service will fall back to the local file located under config/config.conf.
The microservice while try to put the log file in the /var/log/corona-dashboard folder. If the service is not able to access or find that folder, the logging file gets created in the local folder logs.
If you want to enable debug messages please change the configuration file or run the microservice with the commandline parameter -debug.
Pull requests are welcome. For major changes, please open an issue first to discuss what you would like to change.