This code base was created to analyze the trajectories of nanodiamonds being tracked within macrophages. The trajectories are plotted in order to compare how different types of trajectories differ from one another and extract insights on how useful certain features of trajectories are at identifying trajectory types. Specifically, the three types of trajectories that are bging compared are trajectoires of nanodiamonds traveling through macrophages in M0 stage, M1 stage, and M2 stage.
Main.py is the main file which when run carries out the plotting. It creates a TCKFileReader object to read in the trajectory values from tck files and converts these values to a Points class object, it creates a list of the graphs that are to be plotted and stores the data associated in each graph as a GraphParameters object, and then it plots the GraphParameters and Points objects using a SinglePointCompareTrajectoriesFactory object. If two dimensions are created within a graph parameters object the following type of graph is created:
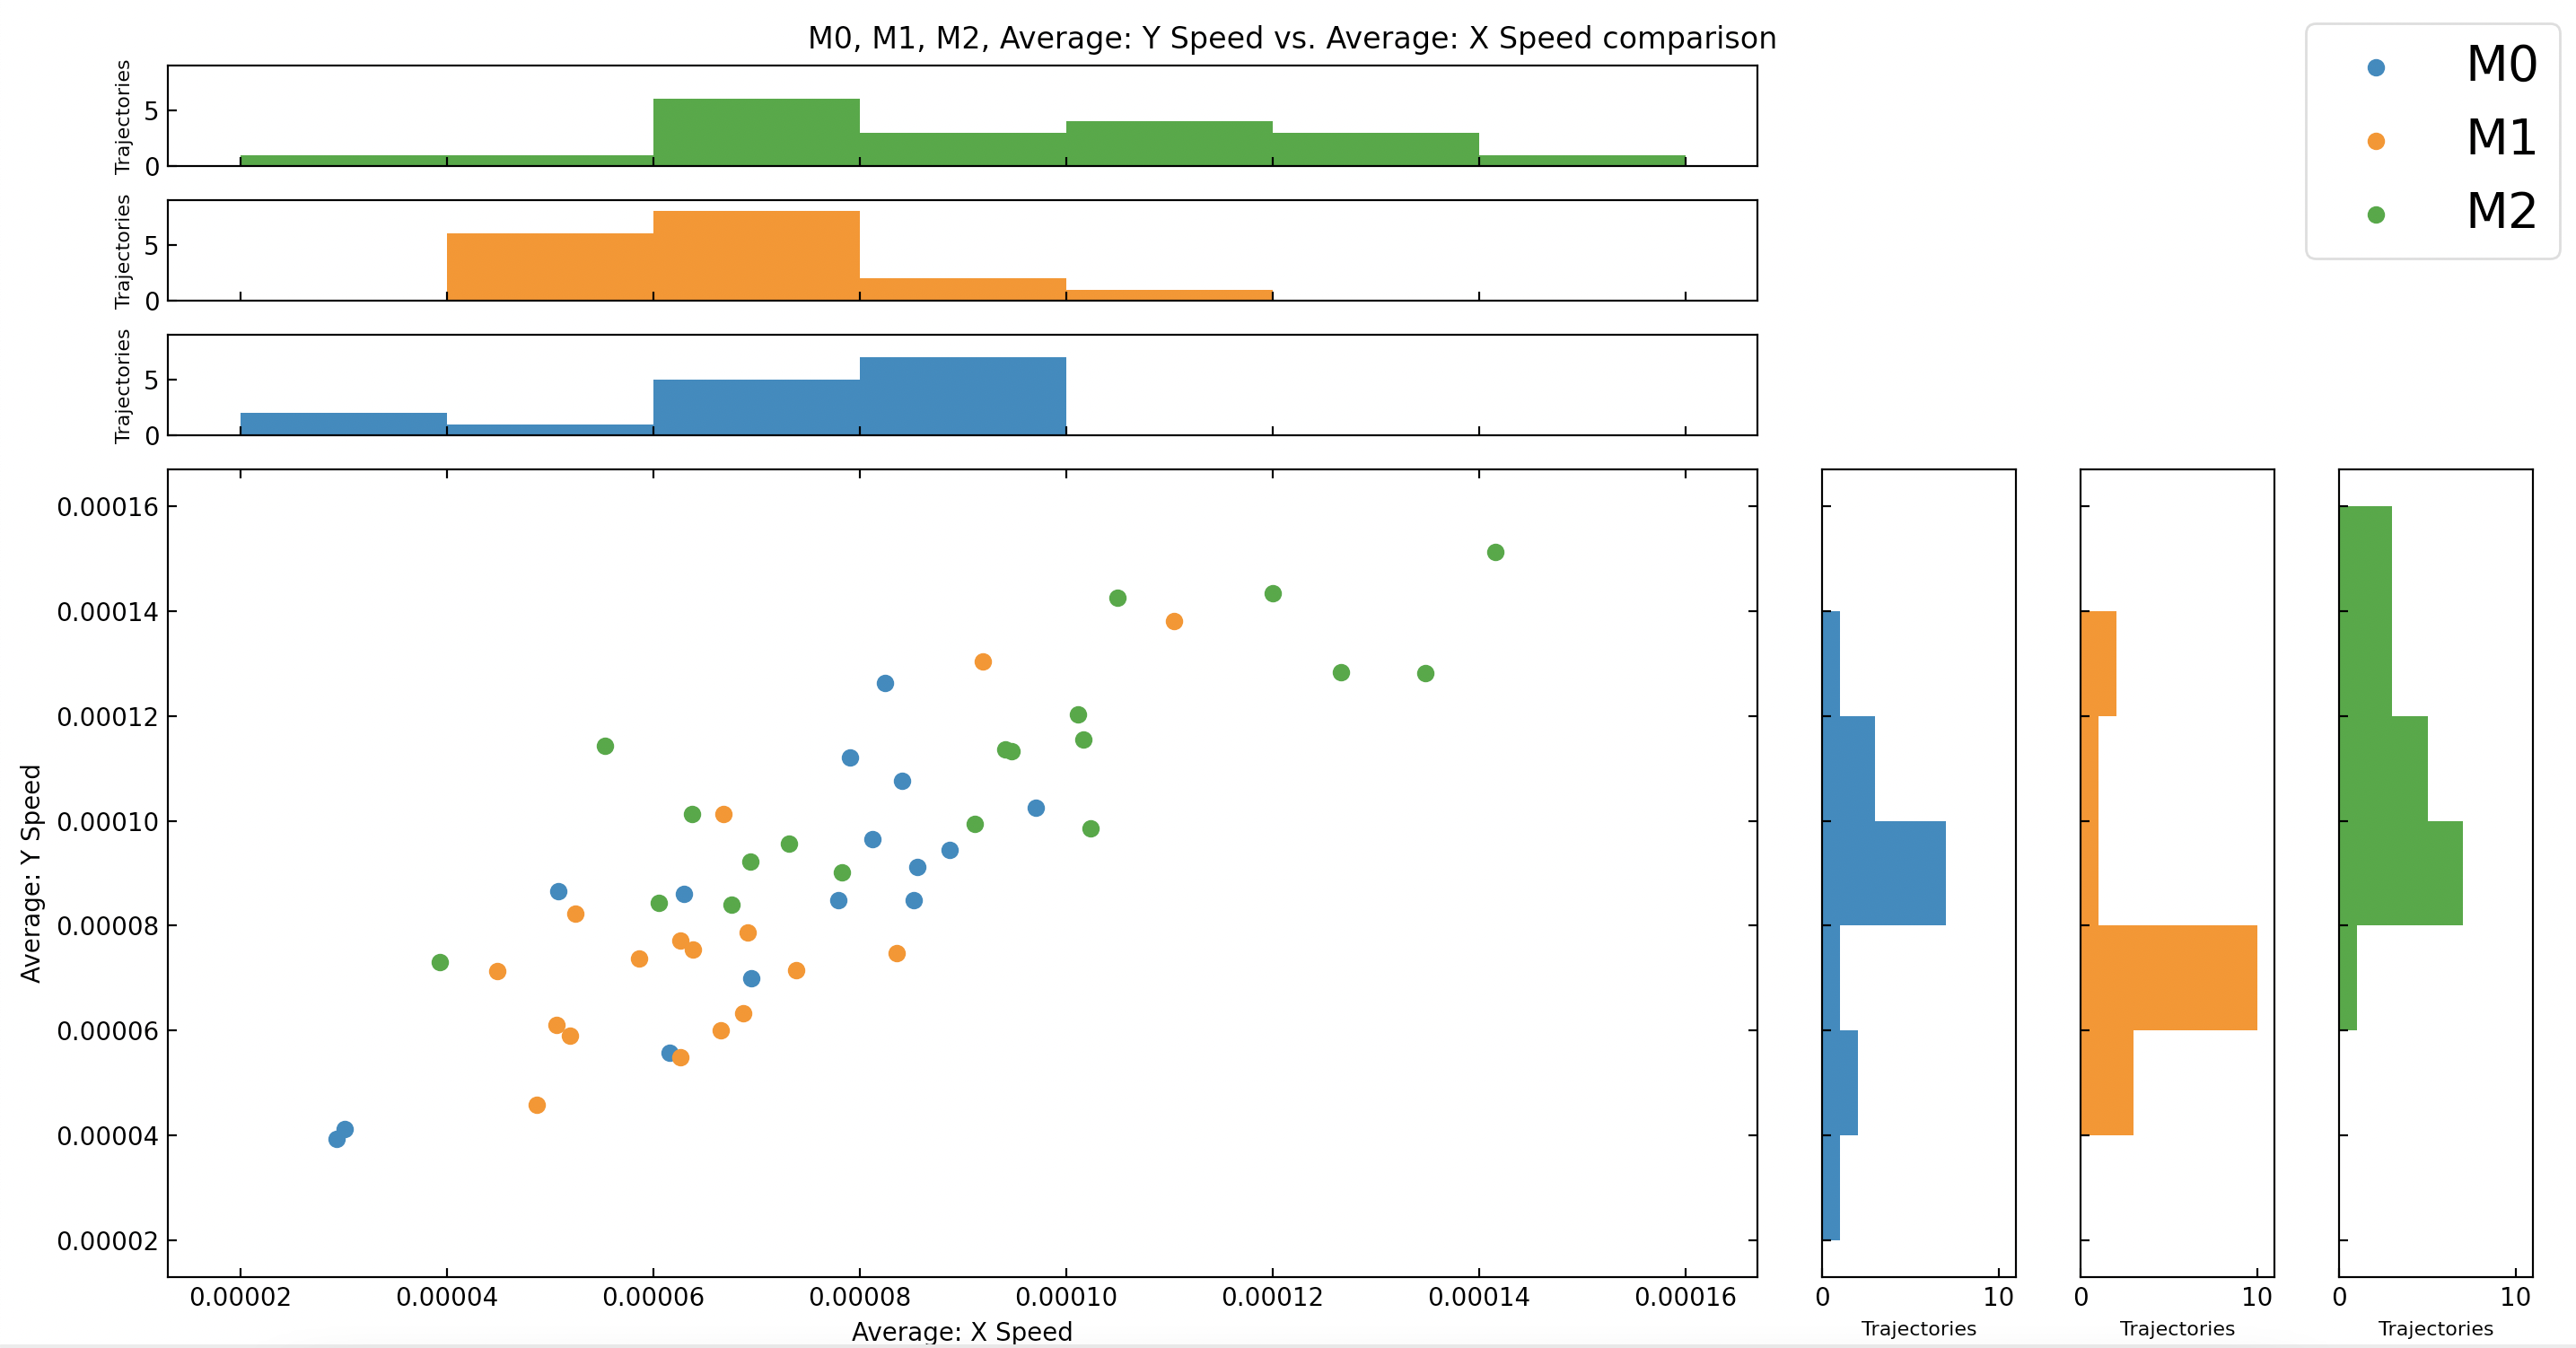 Each point on the graph corresponds to a trajectory, and the points are color-coded based on category of trajectory they belong to. These categories and points are all stored within a variable called stageCategories in Main.py and can be changed to fit a user's needs. The X and Y axes are determined by the X and Y FeatureCreatorBase objects passed in. If only one dimension is created within a graph parameter object the following type of graph is created:
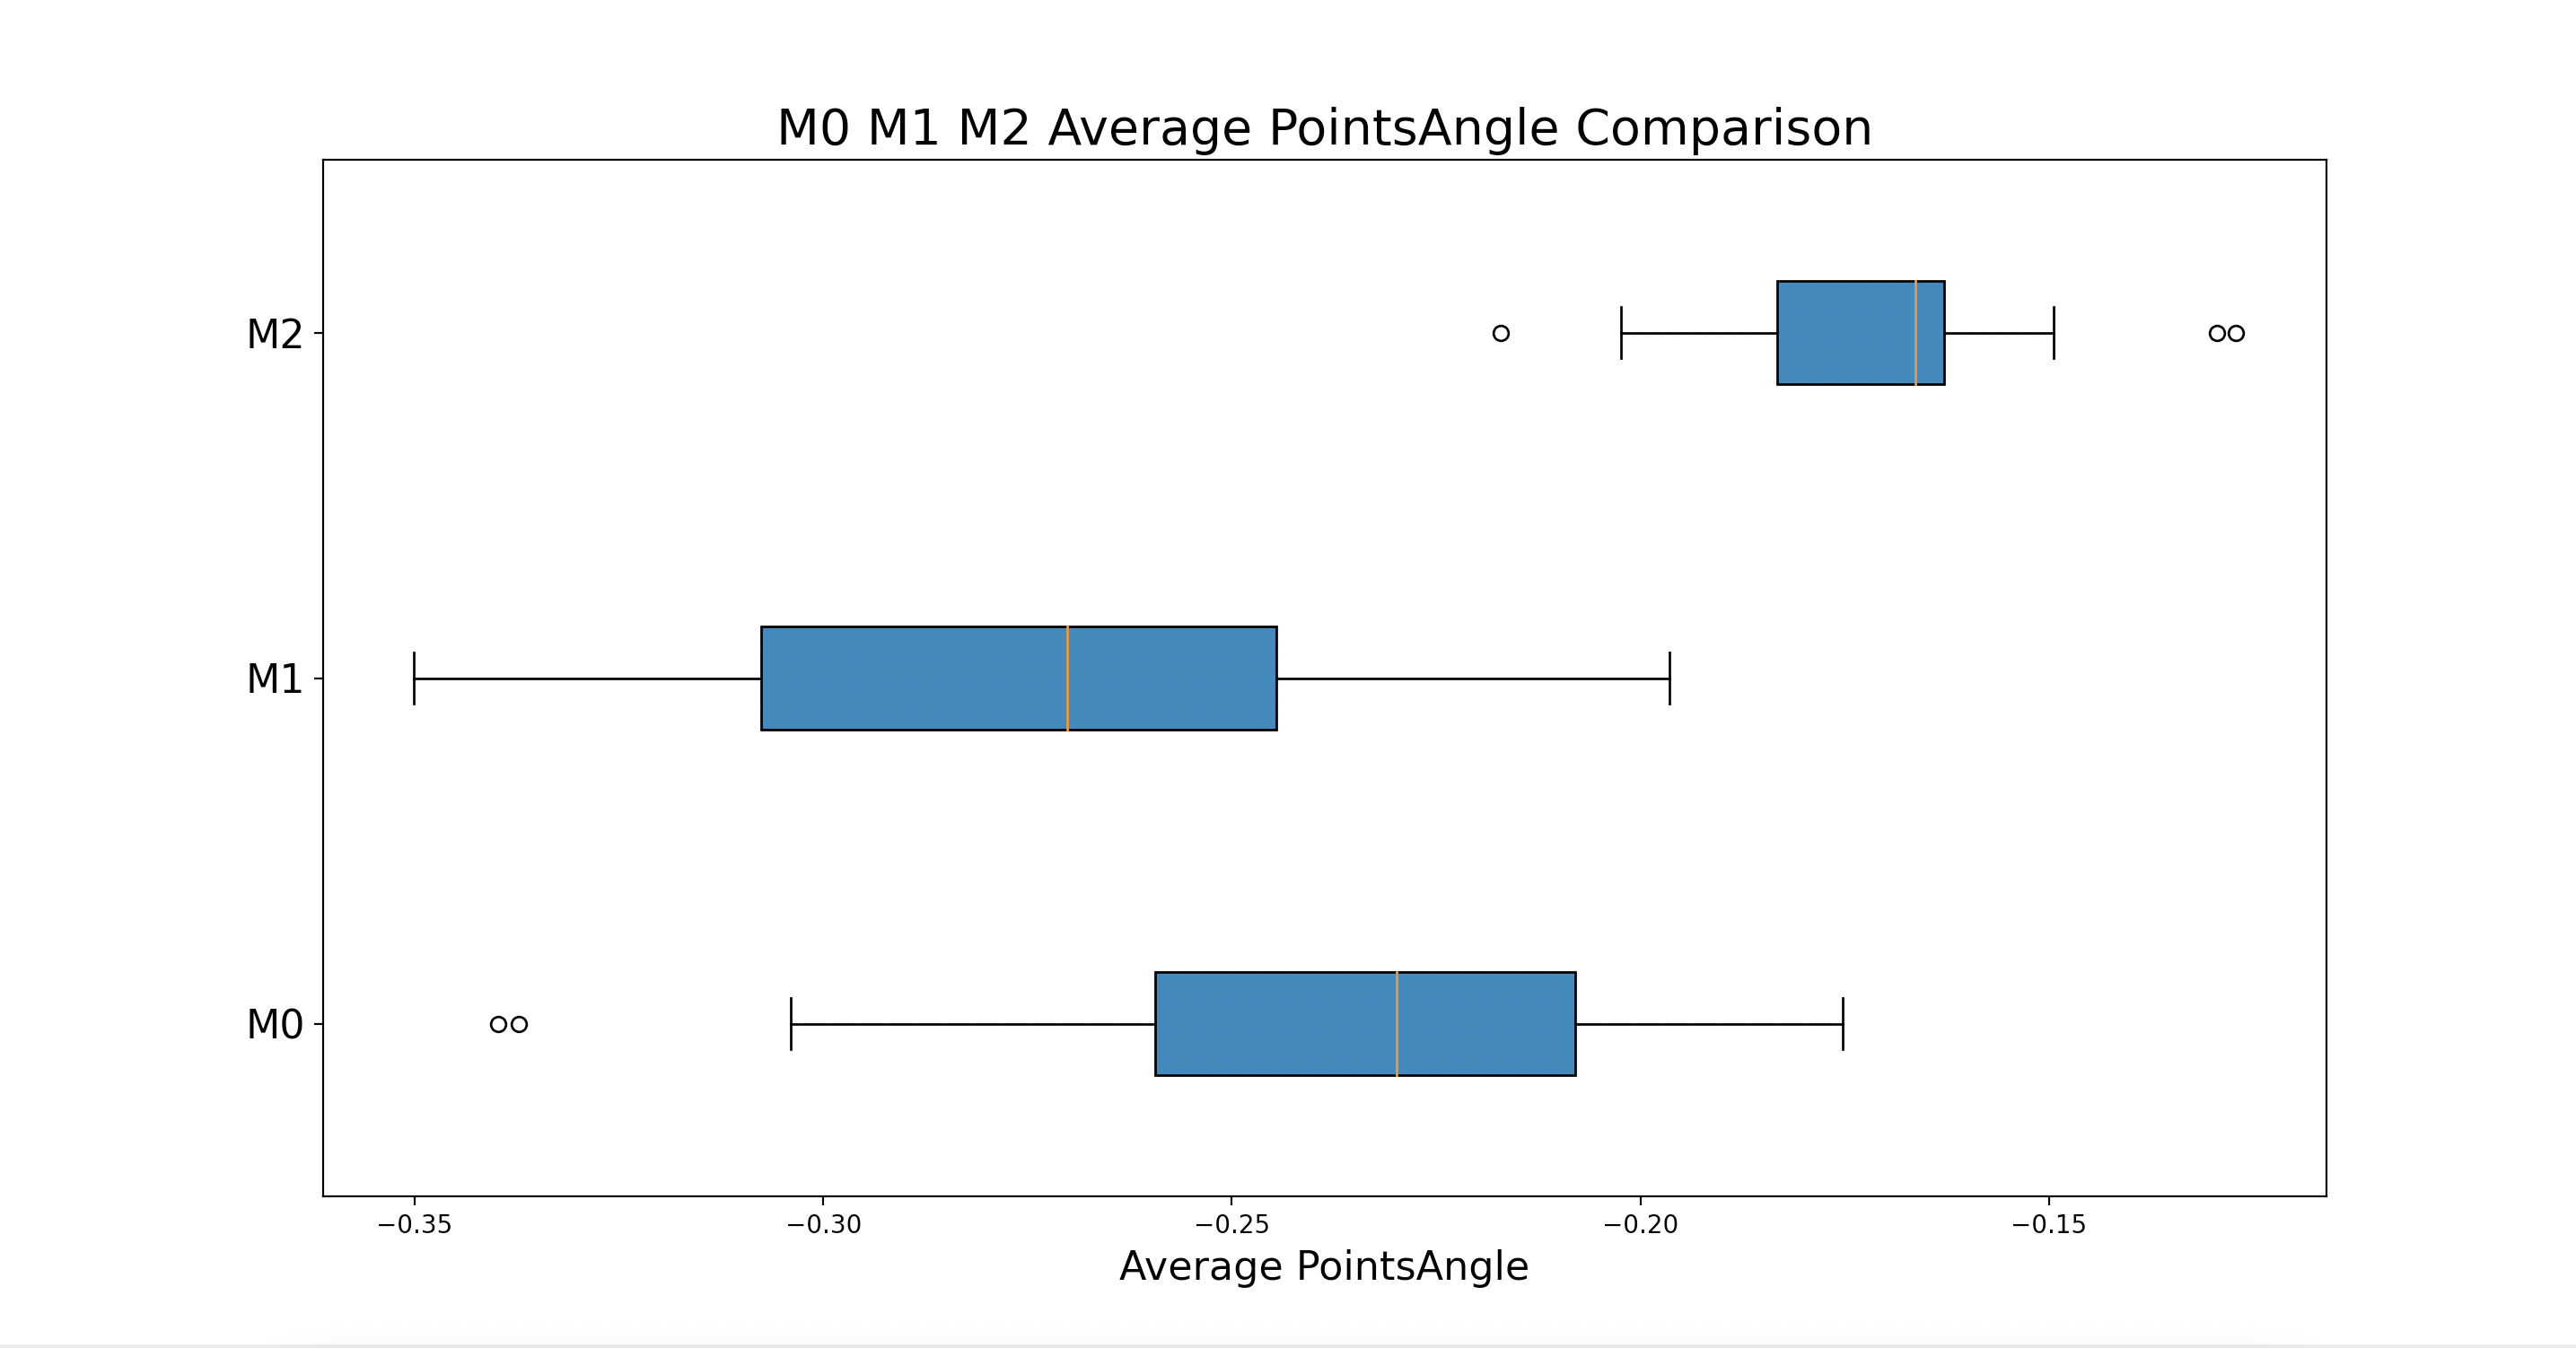 The number of box plots corresponds to the number of categories being graphed as specified by the stageCategories variable. All of the Points from each stage are used to form the box plots.
The following is a description of the general pipeline to plot these trajectories. The points are read in from tck files, useful features are extracted from them, and then these features are reduced to single values that can be plotted to visually show the difference between trajectories. The data is read in by a TCKFileReader object which is located in the tckfilereader directory to generate a Points object. From there the Points object is passed to various feature creators which are all located in the features directory. These feature creators create Features objects which are the data structure that holds all of the feature values associated with the data. From there each Features instance is passed to a FeatureToSingleValBase object which are all located in the featuretosingleval directory. These objects reduce the Features object to a single value that is representative of all of the feature values in order to plot that single value. The resulting single value is passed to an object that will plot that single value against all of the other trajectory’s single value representations. A list of all of these steps is detailed below:
- A TCK file is passed to a TCKFileReader object to create a Points object
- A Points object is passed to various FeatureCreatorBase objects to create various Features objects
- A Features object is passed to a featurestosingleval object to reduce the those Features values down to one value to be plotted
- The result of the featurestosingleval object is plotted against other Features objects that have been reduced down to a single value.
- This process is repeated for all of the trajectories in order to plot each trajectory against one another.
A concrete example of these steps is detailed below:
- The tck file name MyTrajectory.tck is passed to a tckfilereader object to create Points object called myPoints
- myPoints is passed to an XFeatureCreator object which then creates a Features object that contains all of the X values from my trajectory. This Features object is called myXFeatures
- myXFeatures is passed to an AverageOfFeature object to take the average of all of the X values. This is the single value that will be plotted.
- The average that is taken of all of the X values is plotted.
- This process is repeated on many trajecotories to compare their average X values against one another
The code corresponding with the preceding example is shown below.
from tckfilereader.TCKFileReader import TCKFileReader
from features.XFeatureCreator import XFeatureCreator
from featuretosingleval.AverageOfFeature import AverageOfFeature

tckFileReader = TCKFileReader()
myPoints = tckFileReader.get_points("MyTrajectory.tck")
xFeatureCreator = XFeatureCreator()
myXFeatures = xFeatureCreator.get_features(myPoints)
averageOfFeature = AverageOfFeature()
averageX = averageOfFeature.get_val(myXFeatures)
#averageX is then plotted and this process is repeated in order to find and plot the average x value of many trajectories.
In practice the user only needs to create objects for the Points, the FeatureCreatorBase(s), the FeaturesToSingleValBase(s) and pass these objects into a plotting object and it will go through the process detailed above. The data structure called GraphParameters which is located in the plotting directory is intended to store each of the above mentioned objects for each graph intended to be created.