HERE is the link to the dashboard
This repository will hold the code and structure layout for the dashboard.
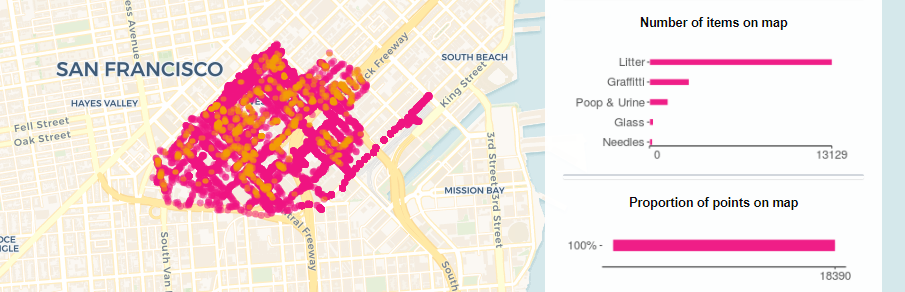
The dashboard is an interactive data analysis board for a Community Cleanup held by Rubbish of SoMa West, San Fancisco, CA. They gathered 20 volunteers to get close to 30K data points, and to clean up the streets of SoMa West. This dashboard was created to give back to the community, and the city of SoMa West used the dashbaord to determine how to improve their city!
It utilizes a Leaflet map for the base of the board, showing all the litter, and other items tracked, on the map itself. It has several graphs that relay from what is currently showing on the users map; a bar-graph, a proportion bar, and a binned heatmap. These 3 graphs will change based on what the user is looking at, and can be disabled. While the bar-graph and proportion bar are self explanitory, the binned heatmap is a bit different. It takes all the points on the map, and categorizes them into X bins, based off the users input, to give a simpler breakdown of where the most litter is. This is useful for breaking SoMa up into 4 sections, or 20,000 sections!
The dashboard itself is utilizing RShiny as a framework, and server, however that does not mean the dashboard is fully written in R. The dashboard utilizes Python, JS, CSS, and HTML, alongside R. This makes the structure of the dashboard very malleable, being able to use integrate almost anything from many languages. Inside the repository itself, the code is broken down into more detail.