In statistics, sampling refers to the process of selecting a subset of individuals or items from a larger population with the aim of making inferences or conclusions about the entire population. The subset chosen is known as the sample, while the entire group being studied is referred to as the population.
Sampling is a crucial aspect of statistical analysis because it allows researchers to gather data efficiently and make generalizations about a population without having to study every individual within that population. However, for the inferences drawn from a sample to be valid, it's essential that the sample is representative of the population it is drawn from.
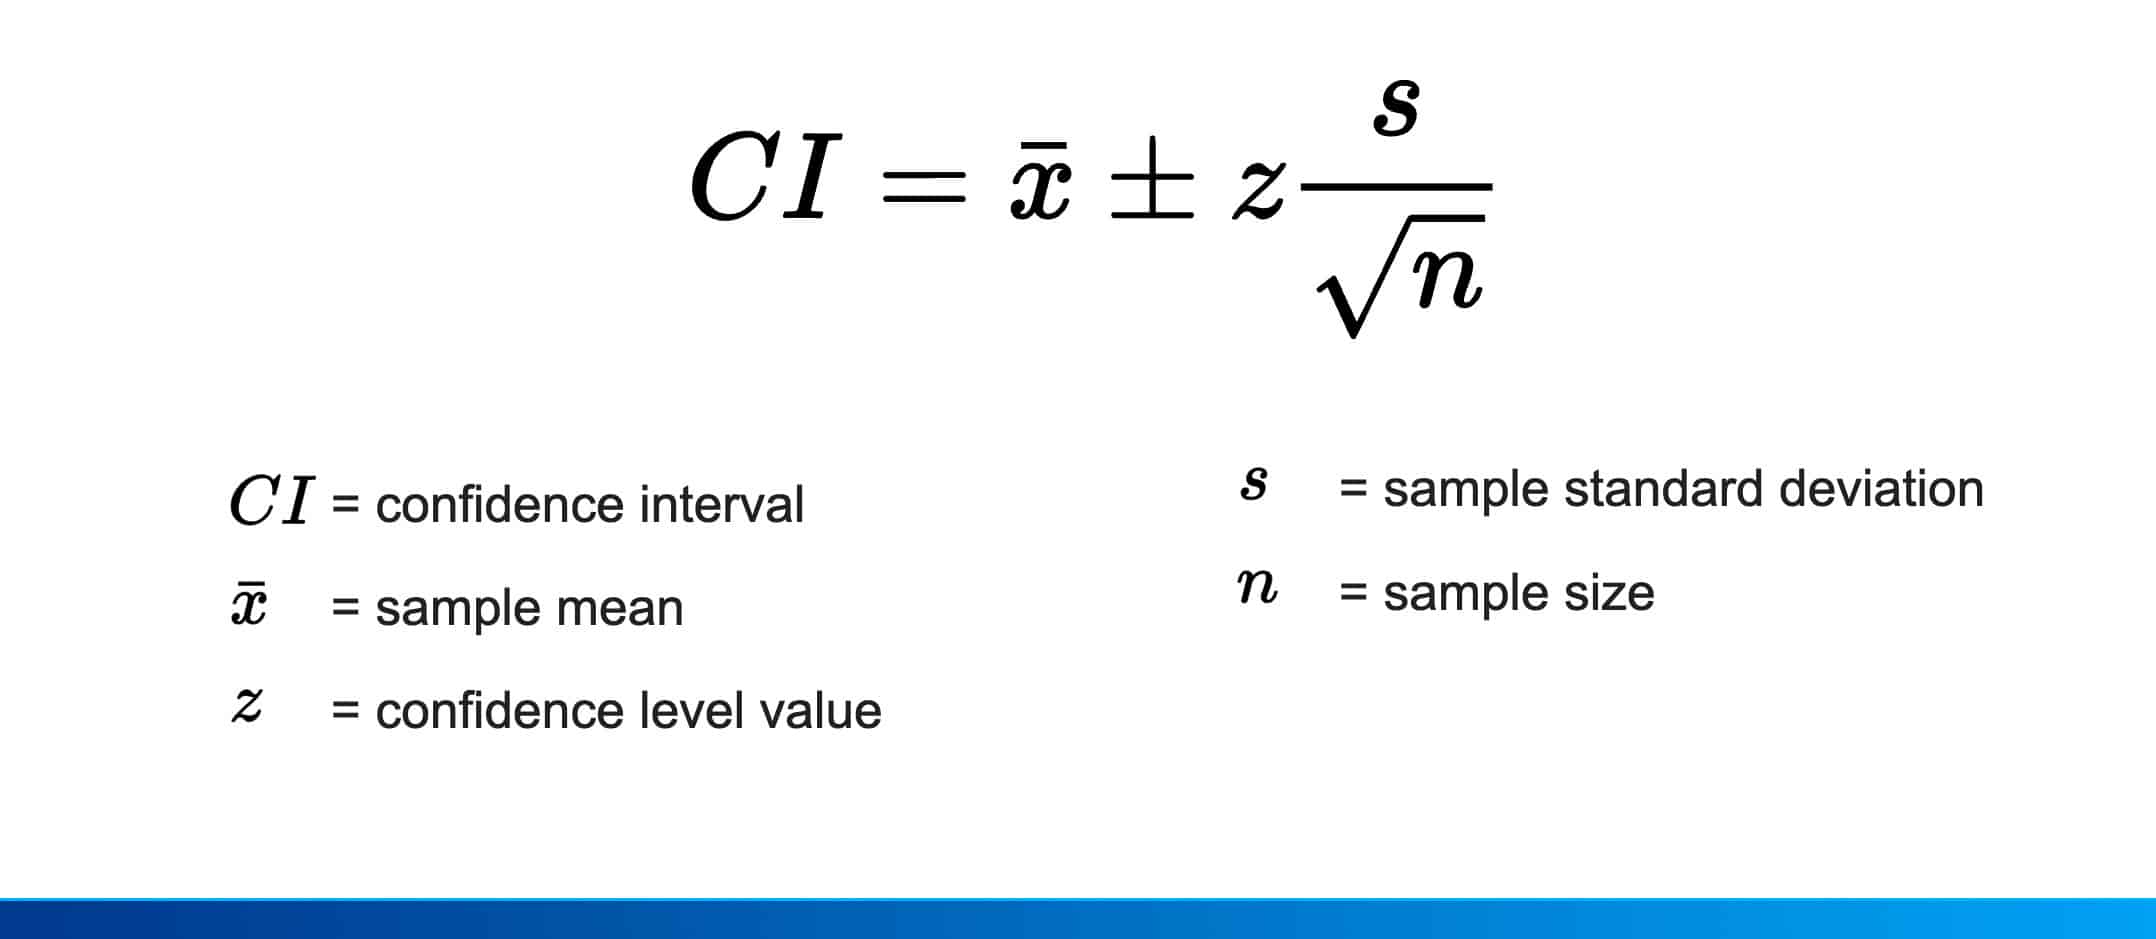
A confidence interval is the mean of your estimate plus and minus the variation in that estimate. This is the range of values you expect your estimate to fall between if you redo your test, within a certain level of confidence. Confidence, in statistics, is another way to describe probability.

- Bernoulli Distribution: Models a single experiment with two possible outcomes (e.g., success/failure, heads/tails).
-
Binomial Distribution: Describes the number of successes in a fixed number of independent Bernoulli trials.
-
Poisson Distribution: Models the number of rare events in a fixed interval of time or space.
The probability theorem that describes the long-term stability of random variables is the law of large numbers.
-
Normal Distribution :The normal distribution is one of the most important and widely used continuous probability distributions in statistics. The normal distribution represents a bell-shaped distribution that is symmetrical and has its peak at a single central point. This distribution is observed in many natural processes and sampling distributions thanks to the central limit theorem.
Hypothesis testing is a statistical method used to test a specific claim based on sample data. Typically, two opposing hypotheses are worked with: the null hypothesis (H0) and the alternative hypothesis (H1). The null hypothesis usually refers to the current situation or the default situation, while the alternative hypothesis states that the null hypothesis is not true.


