-
Notifications
You must be signed in to change notification settings - Fork 140
900_060_bootstrap_ChartNew.js
Francois Vancoppenolle edited this page Nov 8, 2015
·
10 revisions
Previous Chapter Previous Page Next Page Table of content
With some useful modules, you can write HTML pages with tags like this :
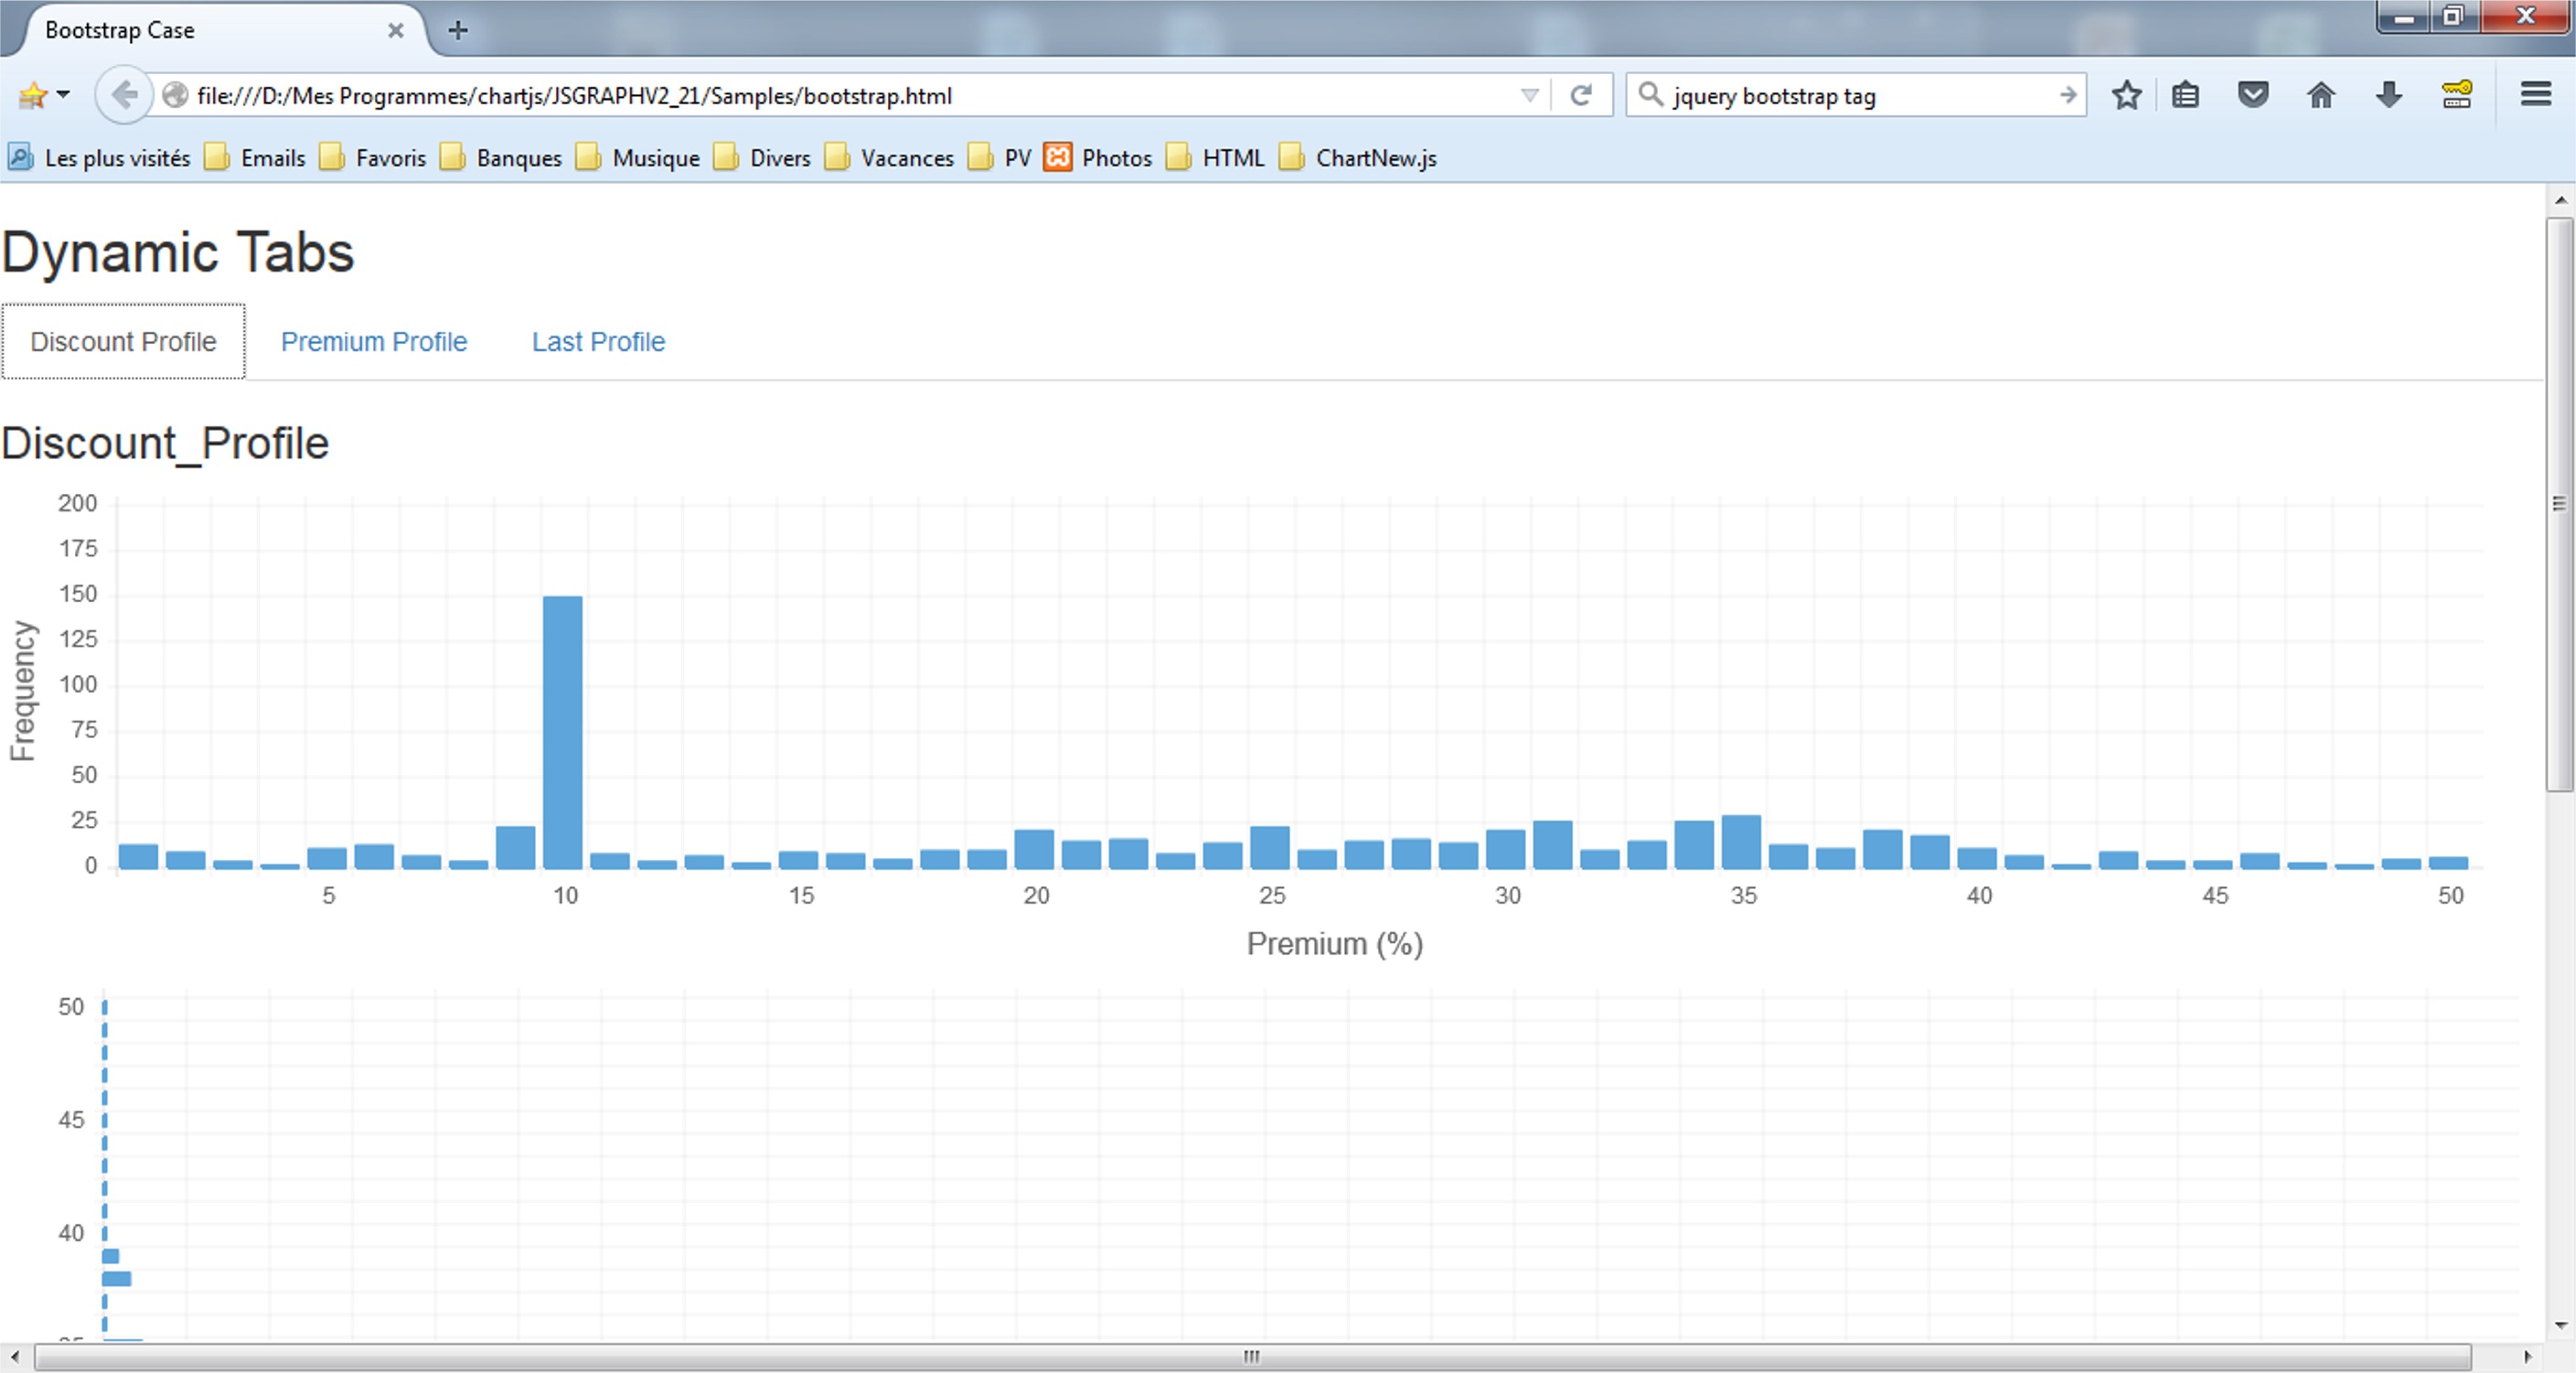
If in those tags, you want to display responsive charts (option responsive : true), you will encounter some difficulties with the display. The Add-ins module "bootstrap_ChartNew.js" has been written to facilitate the development of such HTML document. A sample can be found in "Samples\bootstrap.html".
In the "divs" where you want to display charts, insert the a javascript line for calling option setCanvas.
Parameters of the setCanvas :
- Type of chart ("Bar", "Line", "StackeBar", "HorizontalBar", "HorizontalStackedBar", "Pie", "Doughnut", or "Polararea");
- the data variable;
- the option variable;
- the height of the canvas in points (default value : 400)
- the width of the canvas in points (default value : 800)
After the "divs", call function setRefreshCanvas (without parameter).
Example :
 <body>

 <h2>Dynamic Tabs</h2>
 <ul class="nav nav-tabs">
     <li class="active"><a data-toggle="tab" href="#Discount_Profile">Discount Profile</a></li>
     <li><a data-toggle="tab" href="#Premium_Profile">Premium Profile</a></li>
     <li><a data-toggle="tab" href="#Last_Profile">Last Profile</a></li>
 </ul>

 <div class="tab-content">
     <div id="Discount_Profile" class="tab-pane fade in active">
       <h3>Discount_Profile</h3>
       <script>
       setCanvas("Bar",linedata_Discount_Profile,barChartOptions2,150,800);
       setCanvas("HorizontalBar",linedata_Premium_Profile,barChartOptions1);
       </script>
     </div>
     <div id="Premium_Profile" class="tab-pane fade">
       <h3>Premium Profile</h3>
       <script>
       setCanvas("Line",linedata_Premium_Profile,barChartOptions1);
       setCanvas("HorizontalBar",linedata_Discount_Profile,barChartOptions2);
       </script>
     </div>
     <div id="Last_Profile" class="tab-pane fade">
       <h3>Last Profile - no chart here</h3>
     </div>
 </div>

 <script>
 setRefreshCanvas();
 </script>

 </body>
- var tag_def_height=400 : default height for the canvas when the height is not specified in the setCanvas call;
- var tag_def_width=800 : : default width for the canvas when the width is not specified in the setCanvas call;
- var tag_animation_only_at_first_display=false : change this value to true, if you want that the animation of the canvas occurs only at the first display;
