900_090_Advanced_Legend
Previous Chapter Previous Page Table of content
In the core module of ChartNew.js, a "standard" legend with very limited possibilites to format it can be drawn. With this "Add-ins", you get lot of possibilities to format the legend.
Example :
ENCORE A FAIRE !!!!!!!!!!!
In the core of ChartNew.js, two functions have been defined and are used to draw the legend : drawLegend and measureLegend. In order to use this "Add-ins", you have to include it AFTER the ChartNew.js. This Add-ins, will replace those two functions by two new ones with more possibilites.
 <SCRIPT src='../ChartNew.js'></script>
 <SCRIPT src='../Add-ins/drawLegend.js'></script>
If no additional specifications are defined in the code of your program, the new drawLegend and measureLegend functions will behave similar to the functions included in the core of ChartNew.js : the same legend will be drawn.
If you want to use the extended possibilities given by the add-ins, you have to specify a legend section in your data.
Example :
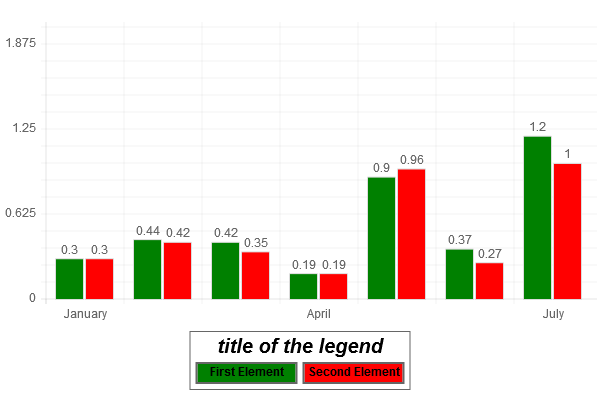
  var mydata = {
  	labels : ["January","February","March","April","May","June","July"],
  	datasets : [
  			{
  			fillColor : "green",
  			data : [0.30,0.44,0.42,0.19,0.90,0.37,1.20],
  			title : "Bar 1"
  			},
  			{
  			fillColor : "red",
  			data : [0.30,0.42,0.35,0.19,0.96,0.27,1.00],
  			title : "Bar 2"
  			}
  	],
  	legend : [
  		{
  			element:"CR",
  			nextLineAlign : "center",
  		},
  		{
  			element : "shapeText",
  			text : "title of the legend",
  			elementWidth: "titre1",
  			elementHeight : "titre1",
  			fontSize : 20,
  			fontStyle : "bold italic",
  			fontColor: "black"
  		},
  		{
  			element:"CR"
  		},
  		{
  			element : "shapeText",
  			text : "First Element",
  			fontStyle : "bold",
  			fontColor: "black",
  			textVPos : 2,
  			textHPos : 2,
  			elementWidth: "width1",
  			elementHeight : "height1",
  			shapeWidth : "widthShape1",
  			shape : "rectangle",
  			shapeFillColor : "green"
  		},
  		{
  			element : "shapeText",
  			text : "Second Element",
  			fontStyle : "bold",
  			fontColor: "black",
  			textVPos : 2,
  			textHPos : 2,
  			elementWidth: "width1",
  			elementHeight : "height1",
  			shapeWidth : "widthShape1",
  			shape : "rectangle",
  			shapeFillColor : "red"
  		}
  	]
  }
We will now explain what you have to specify in the legend section !
A legend is a collection of elements; An element is composed of a shape and/or a text.
In previous example, there are 3 elements : "Title of the legend" is the first one (this element has no shape associated), "First Element" and the green rectangle around is the second element; "Second element" and the red rectangle around is the third one. For each of those elements, there is a specification in the legend section in the data.
Those 3 elements have to be positionned in the legend. In the example, two additionnal specifications are necessary to set their position : one to specify that the title has to be centered and one after the title to force the display of the 2 other elements on another line.
So for the example, the legend section is composed of five specifications : one for each of the 3 elements and 2 for the positionning of those elements.
The legend is described through a table composed of two types of elements : "shape and/or text" elements and "positionning" elements.
 var mydata = {
    labels : [...],
    datasets : [...],
    legend : [<element 1>,<element 2>,...,<element n>]
 }
Each element in the legend section is a group of variable. One of these variable is "element" which describe the type of the element. The value of element has to be "shapeText" for an element associated to a "shape and/or text" element; "CR" for a positionning element.
 var mydata = {
    labels : [...],
    datasets : [...],
    legend : [
            {
                element : "CR",
                ...
            },
            {
                element : "shapeText",
                ...
            }
         ]
  }
It the variable element is not specificed, the default value for it is "shapeText".
In the next sections, we will explain the other variables.
Each time you want to force the positionning of an element on the next line, you have to insert a "CR" element.
By default, (1) "shapeText" element are left aligned; (2) between two lines, there is a space of 5 points; (3) on a same line, each element are centered on the line; (4) there is no maximum number of element on a line.
When you want to change one of those default values, you have to add variable in the "CR" element.
To change the alignment of the "shapeText", you have to specify the alignment in the variable "nextLineAlign". The new alignment will be applied for the "shapeText" elements specified after the change.
Allowed value for variable nextLineAlign : "left", "center", "right".
can be one of the following :
- A shape and a text
- A shape
- A text
The legend section is a table composed of one or more elements.
Each elements can have several variables