900_090_Advanced_Legend
Previous Chapter Previous Page Table of content
In the core module of ChartNew.js, a "standard" legend with very limited possibilites to format it can be drawn. With this "Add-ins", you get lot of possibilities to format the legend.
Example :
ENCORE A FAIRE !!!!!!!!!!!
In the core of ChartNew.js, two functions have been defined and are used to draw the legend : drawLegend and measureLegend. In order to use this "Add-ins", you have to include it AFTER the ChartNew.js. This Add-ins, will replace those two functions by two new ones with more possibilites.
 <SCRIPT src='../ChartNew.js'></script>
 <SCRIPT src='../Add-ins/drawLegend.js'></script>
If no additional specifications are defined in the code of your program, the new drawLegend and measureLegend functions will behave similar to the functions included in the core of ChartNew.js : the same legend will be drawn.
If you want to use the extended possibilities given by the add-ins, you have to specify a legend section in your data.
Example :
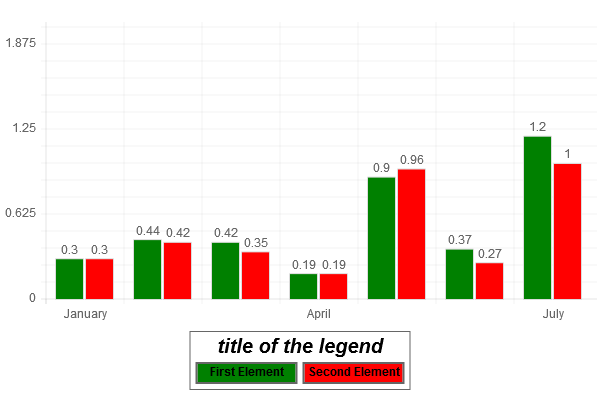
  var mydata = {
  	labels : ["January","February","March","April","May","June","July"],
  	datasets : [
  			{
  			fillColor : "green",
  			data : [0.30,0.44,0.42,0.19,0.90,0.37,1.20],
  			title : "Bar 1"
  			},
  			{
  			fillColor : "red",
  			data : [0.30,0.42,0.35,0.19,0.96,0.27,1.00],
  			title : "Bar 2"
  			}
  	],
  	legend : [
  		{
  			element:"CR",
  			nextLineAlign : "center",
  		},
  		{
  			element : "shapeText",
  			text : "title of the legend",
  			elementWidth: "titre1",
  			elementHeight : "titre1",
  			fontSize : 20,
  			fontStyle : "bold italic",
  			fontColor: "black"
  		},
  		{
  			element:"CR",
  			nextLineAlign : "center"
  		},
  		{
  			element : "shapeText",
  			text : "First Element",
  			fontStyle : "bold",
  			fontColor: "black",
  			textVPos : 2,
  			textHPos : 2,
  			elementWidth: "width1",
  			elementHeight : "height1",
  			shapeWidth : "widthShape1",
  			shape : "rectangle",
  			shapeFillColor : "green"
  		},
  		{
  			element : "shapeText",
  			text : "Second Element",
  			fontStyle : "bold",
  			fontColor: "black",
  			textVPos : 2,
  			textHPos : 2,
  			elementWidth: "width1",
  			elementHeight : "height1",
  			shapeWidth : "widthShape1",
  			shape : "rectangle",
  			shapeFillColor : "red"
  		}
  	]
  }
We will now explain what you have to specify in the legend section !
A legend is a collection of elements; An element is composed of a shape and/or a text.
In previous example, there are 3 elements : "Title of the legend" is the first one (this element has no shape associated), "First Element" and the green rectangle around is the second element; "Second element" and the red rectangle around is the third one. For each of those elements, there is a specification in the legend section in the data.
Those 3 elements have to be positionned in the legend. In the example, two additionnal specifications are necessary : one for the title to specify that the title has to be centered and one after the title to force the display of the 2 other elements on another line. 2 additionnal specifications have been inserted in the legend section.
So for the example, the legend section is composed of five specifications : one for each of the 3 elements and 2 for the positionning of those elements.
The legend is described through a table composed of two types of elements : "shape and/or text" elements and "positionning" elements.
 var mydata = {
    labels : [...],
    datasets : [...],
    legend : [<element 1>,<element 2>,...,<element n>]
 }
Each element in the legend section is a group of variable. One of these variable is "element" which describe the type of the element. The value of element has to be "shapeText" for an element associated to a "shape and/or text" element; "CR" for a positionning element.
can be one of the following :
- A shape and a text
- A shape
- A text
The legend section is a table composed of one or more elements.
Each elements can have several variables