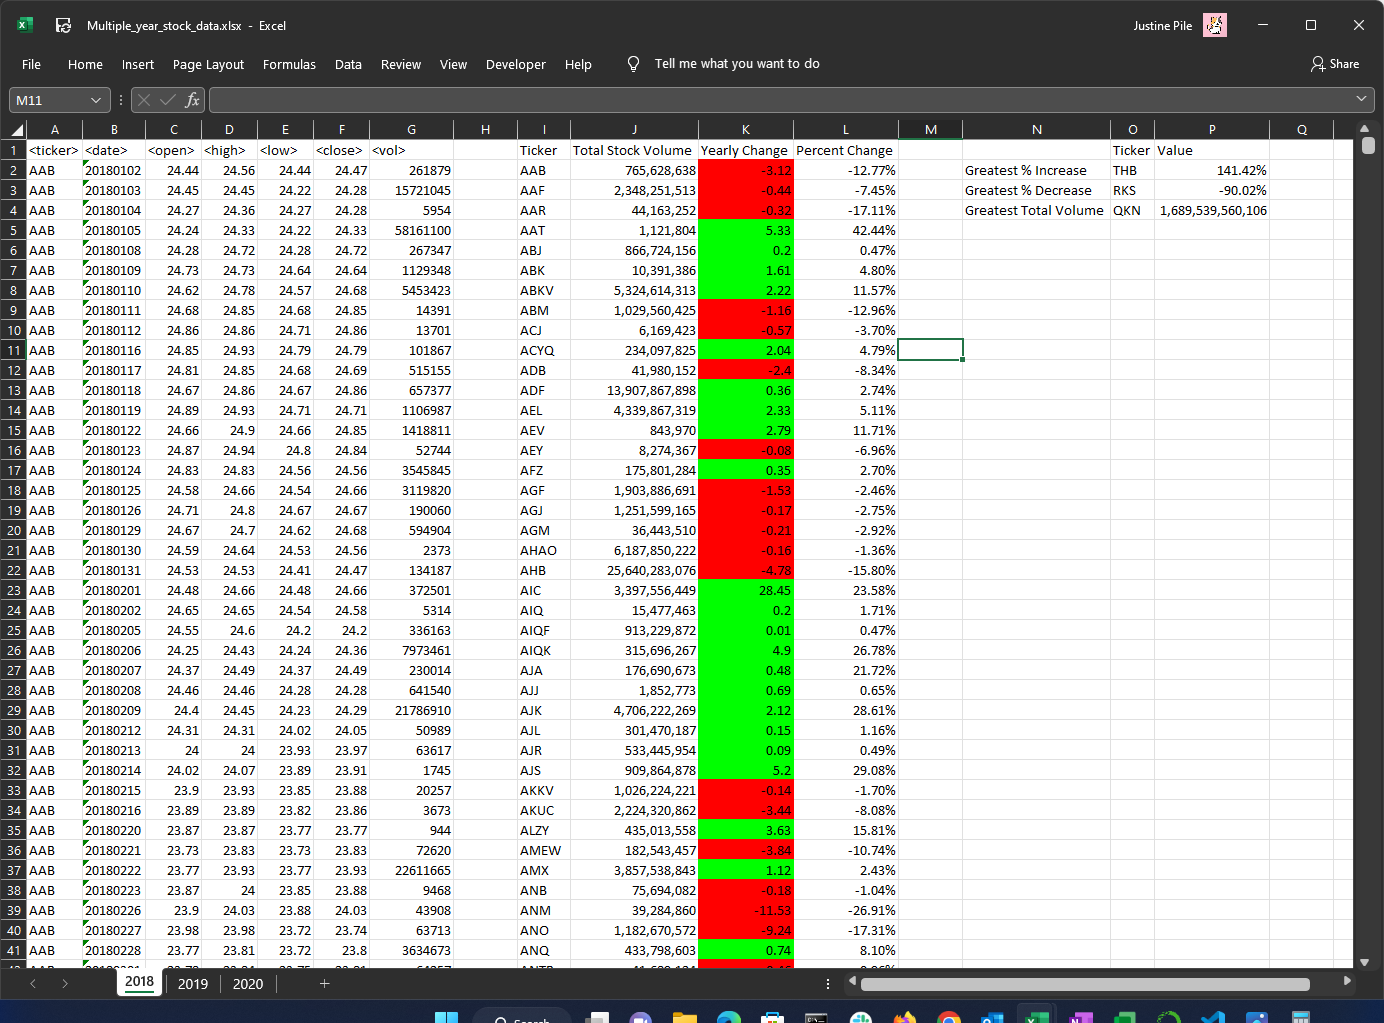
- The yearly change in price for each stock, as well as the percentage
- Also will apply conditional formatting to denote positive or negative change
- The total stock volume
- The greatest % increase
- The greatest % decrease
- The greatest total volume
Worksheet will need to have seven columns (the data in the date, high, and low columns does not matter as it is not used and columns can be named anything):
| Ticker Symbol | Date | Open | High | Low | Close | Volume |
|---|
VB Script is in the root directory along with screenshots
