![]()
spike2py provides a simple interface to analyse and visualise data collected using Spike2 software and Cambridge Electronics Design (CED) data acquisition boards. With it you can easily plot individual channels or all channels from a given trial. In addition, you can easily apply various signal processing methods to your waveform data. Finally, you can easily save your data at any point, allowing you to re-open and continue your work from where they left off.
To demonstrate, the following snippet of code shows you how to:
- Read a file
- Plot the electromyography (EMG) signal from one of the channels
- Remove the mean of the first 500 samples and rectify EMG signal, and plot the result
>>> from spike2py.trial import TrialInfo, Trial
>>> trial_info = TrialInfo(file="sample.mat")
>>> sample = Trial(trial_info)
>>> sample.muscle_emg.plot()
>>> sample.muscle_emg.remove_mean(first_n_samples=500).rect().plot()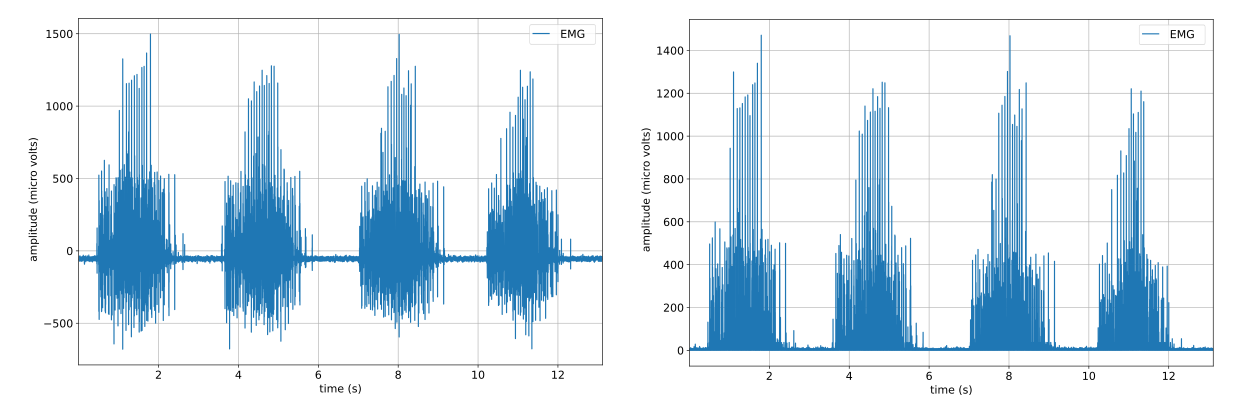
Introductory tutorials, how-to's and other useful documentation are available on Read the Docs
spike2py is available on PyPI:
$ python -m pip install spike2pyspike2py officially supports Python 3.8+.
spike2py works with Matlab files exported from Spike2 v7, or any other Spike2 version that exports to Matlab 5.0 format. Spike2 v10 exports files to Matlab 7.3 format, which is currently not supported by spike2py. The ability to open both Matlab file formats will be added in future version of spike2py.
Like this project? Want to help? We would love to have your contribution! Please see CONTRIBUTING to get started.
This project adheres to the Contributor Covenant code of conduct. By participating, you are expected to uphold this code. Please report unacceptable behavior to [email protected].