This is a little proof-of-concept I wrote for monitoring a Spring Cloud Gateway with Prometheus and Grafana.
Feel free to copy this or use it as a blueprint to build anything you like. I've used docker-compose to make this a smother experience to demo.
It is not at all production ready and you should not treat it as such.
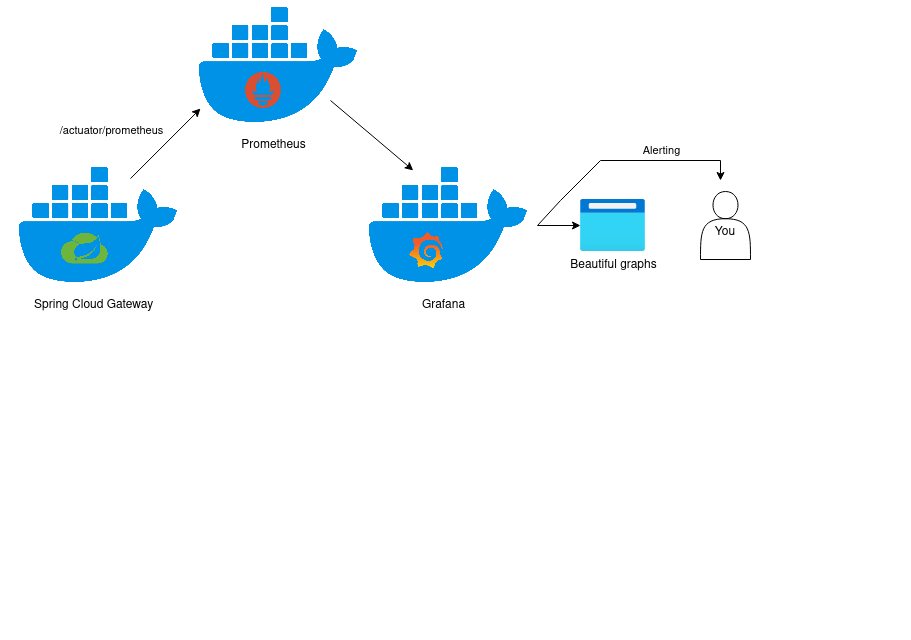
The entire thing is really quite simple.
- The Spring Cloud Gateway collects metrics and exposes them under
/actuator/prometheus - Prometheus collects to metrics and safes them in its database
- Grafana gets its metrics from Prometheus and displays them in fancy graphs. Or sends alerts. Or does do other stuff.
All the custom metrics are collected in this class.
They are really nothing fancy and just count up everytime a request is made or an response is received. In fact the default metrics already implement this function but I thought it is a good example anyway. So I did it again.

If you want to try it yourself just clone this repo and replicate the steps below.
To run this application you need:
- docker
- docker-compose
- JDK 17 or later
- the ability to build this maven project
Build the maven project
mvn clean packageRun docker-compose
docker-compose upIf you execute docker ps you should now see three containers running (some things will differ though)
CONTAINER ID IMAGE COMMAND CREATED STATUS PORTS NAMES
76c2da3da29c prom/prometheus:latest "/bin/prometheus --w…" 2 hours ago Up 2 hours 0.0.0.0:9090->9090/tcp, :::9090->9090/tcp spring-cloud-gateway-monitoring-prometheus-1
37bb0b105e27 grafana/grafana:latest "/run.sh" 2 hours ago Up 2 hours 0.0.0.0:3000->3000/tcp, :::3000->3000/tcp spring-cloud-gateway-monitoring-grafana-1
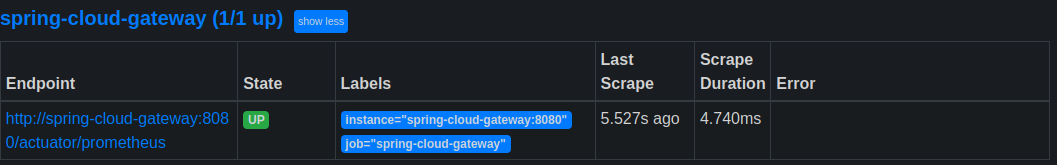
90db75229a20 spring-cloud-gateway:latest "java -jar /app.jar" 43 hours ago Up 2 hours 0.0.0.0:8080->8080/tcp, :::8080->8080/tcp spring-cloud-gateway-monitoring-spring-cloud-gateway-1Also if you open http://localhost:9090/targets?search= you should see that Prometheus can connect to your gateway and receive its metrics.
If you want to 'simulate' traffic, run the example-traffic script. It is just a glorified while-loop, but it does the job.
bash ./example-trafficTo see all the data in Grafana you have to log in and create some dashboards first.
Go to http://localhost:3000 and log in with the user admin and the password admin. In the sidebar you can import dashboards. See here for a tutorial.
Be sure to choose 'Prometheus' as a datasource for all your dashboards.
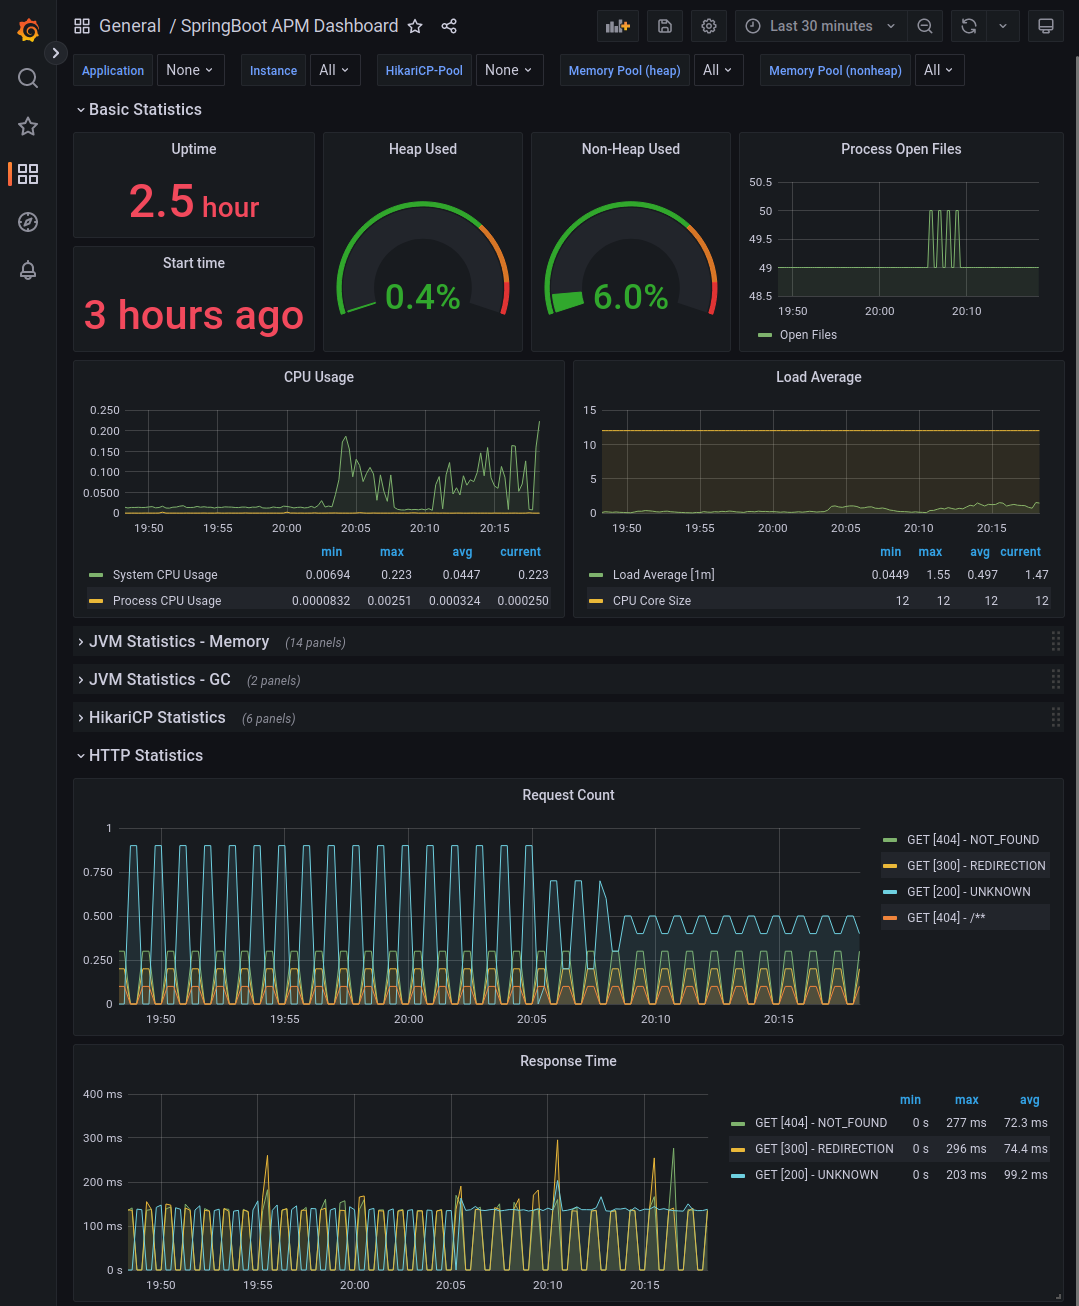
A good one for Spring Boot is this one with the id 12900 by prakarsh.
It should look something like this:
If you've got any issues feel free to create an issue. I respond if I can.
Credit where credit is due