Navigation: Home | Matrixs | Plots
## Plot UsageIntro: Maths.js can be used as a wrapper around plotly for powerful and simple visualization of data. Note, to keep the size of the overall library down, plotly is not included in Maths.js and must be included externally.
Maths.js with Plotting
<script type="text/javascript" src="plotly.min.js"></script>
<script type="text/javascript" src="Maths.js"></script>Ultra basic example:
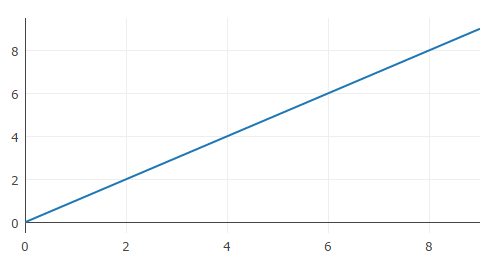
This example generates a basic plot and will append it to your HTML body. You can specify a specific div by adding options object {div:'yourDiv'}.
var x = Matrixs.range(10);
Plots.create(x);
//Plots.create(x,{div:'yourDiv'}); use this to specify a specific div
Y vs X Plot
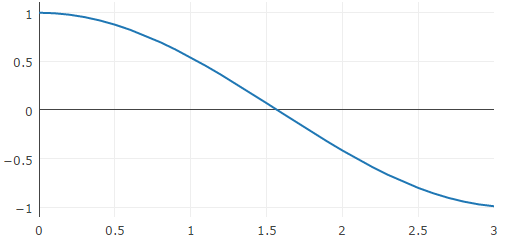
Create a X / Y plot.
var x = Matrixs.range(0,0.1,3);
var y = x.apply(Math.cos);
Plots.create([x,y]);
Multiple traces and scatter plots
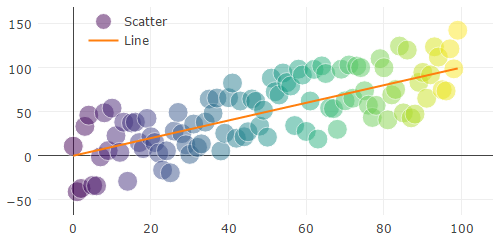
Create a multi trace plot showing both line type and scatter type. Also shows how to give traces a name in the legend.
var X = Matrixs.range(100); // Creates a 0-99 value array
var Y = X.addNoise(0.9); // Adds 90% relative noise
Plots.create(Y,{type:'scatter',name:'Scatter'}); //Creates scatter plot
Plots.add(X,{name:'Line'}); // Adds orange best fit line


