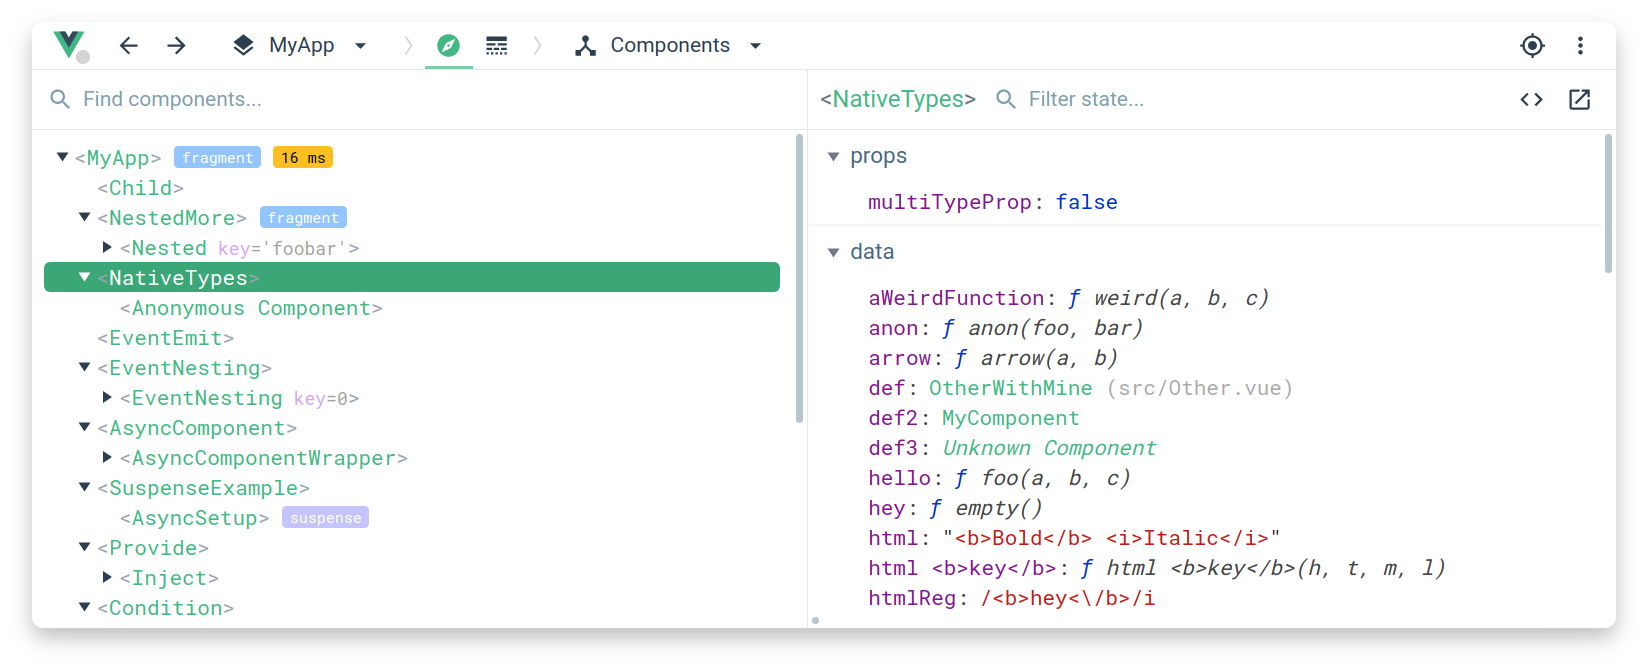
-
If the page uses a production/minified build of Vue.js, devtools inspection is disabled by default so the Vue pane won't show up.
-
To make it work for pages opened via
file://protocol, you need to check "Allow access to file URLs" for this extension in Chrome's extension management panel.
Works with vuex for time-travel debugging:
To enable this feature, follow this guide.
Make sure you are using Node 6+ and NPM 3+
- Clone this repo
npm install(Oryarn installif you are using yarn as the package manager)npm run build- Open Chrome extension page
- Check "developer mode"
- Click "load unpacked extension", and choose
shells/chrome.
- Clone this repo
npm installnpm run dev- A plain shell with a test app will be available at
localhost:8080.
-
Install
web-ext$ npm install --global web-extOr, for Yarn:
$ yarn global add web-extAlso, make sure
PATHis set up. Something like this in~/.bash_profile:$ PATH=$PATH:$(yarn global bin) -
Build and run in Firefox
$ npm run build
$ npm run run:firefox
When using Yarn, just replace
npmwithyarn.
-
Fixing "Download the Vue Devtools for a better development experience" console message when working locally over
file://protocol: 1.1 - Google Chrome: Right click on vue-devtools icon and click "Manage Extensions" then search for vue-devtools on the extensions list. Check the "Allow access to file URLs" box. -
How to use the devtools in IE/Edge/Safari or any other browser? Get the standalone Electron app (works with any environment!)

