AlmaBetter Verified Project - AlmaBetter School
- Introduction
- Problem Statement
- Dataset Information
- Tools and Technologies used
- Steps involved
- Algorithms used
- Conclusion
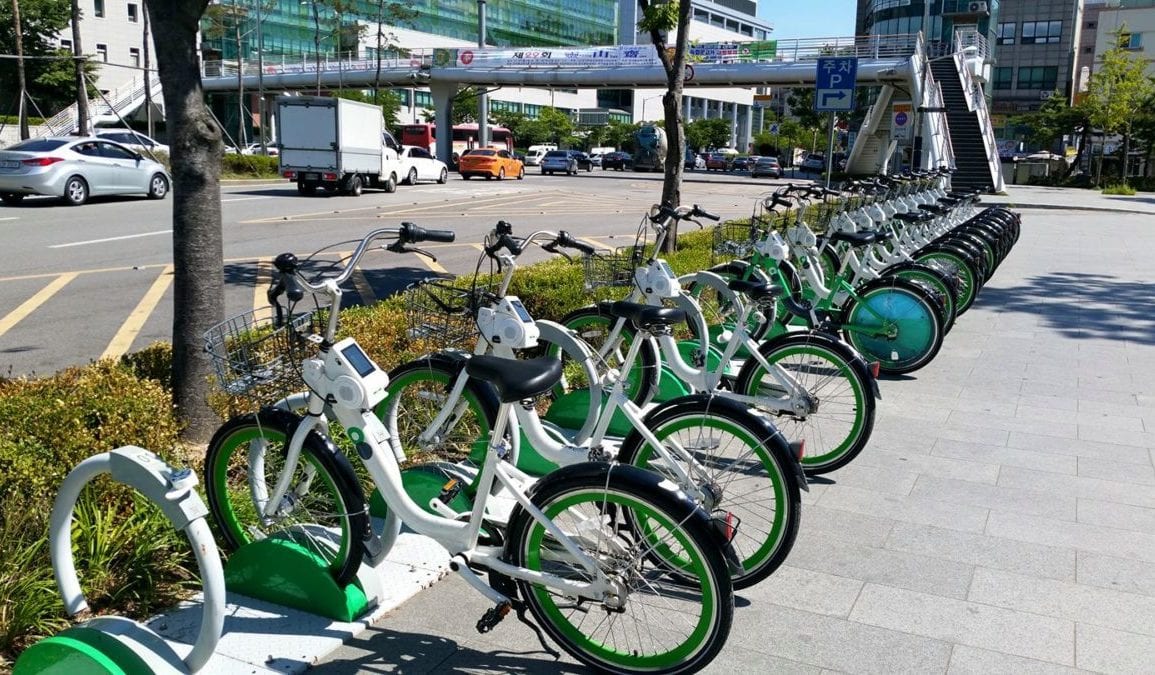
Bike sharing system is an innovative transportation strategy that provides individuals with bikes for their common use on a short-term basis for a price or for free. Over the last few decades, there has been a significant increase in the popularity of bike-sharing systems all over the world. This is because it is an environmentally sustainable, convenient and economical way of improving urban mobility. In addition to this, this system also helps to promote healthier habits among its users and reduce fuel consumption.
🎯 The goals of this project are:
- Understand the trends in the data and identify key factors affecting the hourly demand for rental bikes.
- Build an appropriate regression model to forecast the number of rental bikes required per hour.
With the growing demand and user base for bike-sharing system, providing the city with a stable supply of rental bikes could eventually become a challenging task. The success of bike-sharing system relies in ensuring that the quality of facilities provided, meets the needs and expectations of the users. Therefore, it is important to ensure that rental bikes are available and accessible to the users at right time ,as it reduces the waiting time. Forecasting the number of bikes required and identifying the key factors that influence the demand for rental bikes can greatly help in managing the bike-sharing system.
Dataset used in this project is the Seoul Bike Share program data.This dataset contains information about the total count of rented bikes at each hour, as well as the date of observation and meteorological information (Humidity, Snowfall, Rainfall, Temperature Season, and so on) for that hour. The observations in the dataset were recorded during a span of 365 days, from December 2017 to November 2018.
The Seoul Bike Dataset contains the following information:
- Date - The date of each observation in the format 'year-month-day'
- Hour - Hour of the day
- Temperature - Temperature recorded in the city in Celsius (°C).
- Humidity - Relative humidity in %
- Wind speed - Speed of the wind in m/s
- Visibility - measure of distance at which object or light can be clearly discerned in units of 10m
- Dew point temperature - Temperature recorded in the beginning of the day in Celsius(°C).
- Solar radiation - Intensity of sunlight in MJ/m^2
- Rainfall - Amount of rainfall received in mm
- Snowfall - Amount of snowfall received in cm
- Seasons - Season of the year (Winter, Spring, Summer, Autumn)
- Holiday - Whether the day is a Holiday or not (Holiday/No holiday)
- Functional Day -Whether the rental service is available (Yes-Functional hours) or not (No-Non functional hours)
- Rented Bike count - Count of bikes rented at each hour (target variable)
The programming language used in this project is Python . The following libraries were used for data analysis and data visualization and to build a classifier to predict the price range of mobile phones.
- Pandas : For loading the dataset and performing data wrangling
- Matplotlib: For data visualization.
- Seaborn: For data visualization.
- NumPy: For some math operations in predictions.
- Statsmodels: For statistical computations
- Sklearn: For the purpose of analysis,prediction and evaluation.
- Data Preprocessing : Checked for outliers, incorrect values, missing values, duplicates and performed data type correction.
- Feature Extraction : Created new columns such as Day, Month, Year, Days_of_week and Weekend from Date column .
- Exploratory Data Analysis : Performed Univariate, Bivariate, and Multivariate analysis with various graphs and plots to better understand the distribution of features and their relationships.
- Feature Selection : Checked the VIF value (measure of multicollinearity) and dropped Dew point Temperature and Year which were highly correlated with other independent features.
- Feature encoding : The categorical features present in the dataset Seasons, Holiday, Weekend, Functioning Day were dummified.
- Feature Scaling : Brought features to a similar range using StandardScaler.
- Implementation of Regression models
- Hyperparameter tuning
- Comparison of models
- Linear Regression
- Lasso, Ridge and Elastic-Net Regression
- Polynomial Regression
- Decision Tree
- Random Forest
- XGBoost
- CatBoost
-
Findings from EDA:
- Temperature and Hour have a strong correlation with the count of rented bikes.
- Dew point temperature is highly positively correlated to the Temperature.
- Over the weekend and during holidays, rental bike demand decreases.
- There is a significant drop in the number of rented bikes during Winters(Dec-Feb) because it's freezing cold!
- The demand for bikes increases during warmer temperatures,which is why there's maximum count of rented bikes during the Summer season.
- In all seasons,the peak demands for rental bikes occur on the opening (8-9 AM) and closing times (6-7pm) of offices and institutions.
-
Conclusion Based on Model Evaluation:
- XGBoost regressor was found to be most suitable for making predictions of hourly demand for rental bikes.
- An adjusted R2 score of 0.9449 was obtained from XGBoost model after hyper-parameter tuning.
- Temperature and Hour were found to be most influential variables in predicting the hourly demand for rental bikes.
- When compared to other models used, decision tree-based models have performed well.
- Linear and Polynomial regression models did not perform well in this case, since there is no significant linear correlation between Rented bike count and the independent features.
Radhika R Menon | Avid Learner | Data Scientist | Machine Learning Engineer
Contact me for Data Science Project Collaborations


