Force Bubble Chart is a d3 based Interactive Bubble Chart.
Force Bubble Chart is a simple yet powerful data visualization capable of solving a lot of day-to-day life problems. Relating multiple dimensions using a classifier and showing elegant transition during enter or exit of data helps in getting more insights out of the data and makes the chart stand out from the rest of its likes.
Force Bubble Chart is different from normal Bubble Charts, which are plotted against two axes.
Force Bubble Chart accepts the dimension in the form of a classifier.
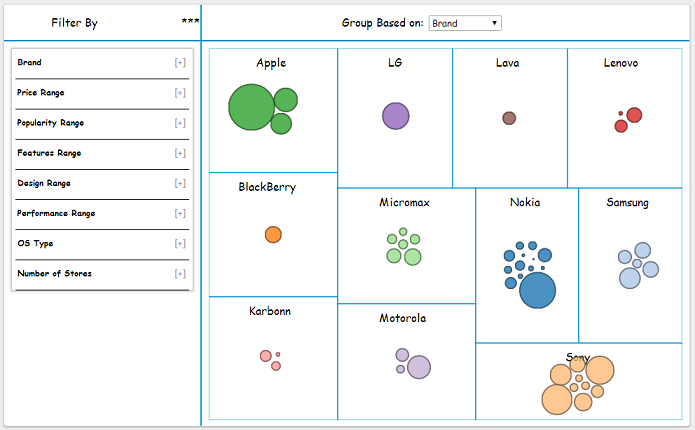
The above snapshot is from a demo page where the Force Bubble Chart is used to visualize Product Filtering. This is a common use case found in all e-commerce websites like eBay, amazon, flipkart made easy using Force Bubble Chart.
Here is the link to the demo.
Below given is a sample constructor of ForceBubbleChart:
fbChart = new ForceBubbleChart({
                bindto: ".chart-holder",    //Hook where chart will be rendered.
                width: 600, //Width of chart svg.
                height: 500,    //Height of chart svg.
                data: chartData,    //Initial data for the chart.
                uniqueProperties: ["id"],   //Unique key for a data row. Can be composite as well.
                tooltipProperties: ["name", "price"],   //Properties to be shown in tooltip information.
                classifier: "OS",    //Initial classifier. The property that is used to categorize data.
                bubbleSize: "price",    //Property mapped to the radius/size of the bubble.
                bubbleColour: "brand"   //Property mapped to the colour of the bubble.
            });
Public API's on ForceBubbleChart are as follows:
-
setDatasetData takes a JSON Array and replaces the chart data with the array. All the data points would be applied with the enter, update, exit transitions out of the box.
-
setClassifiersetClassifier takes a string and set the property as the
classifierwhich is used to categorize or group the data. Each data point would move under the corresponding category with an elegant transition. -
setWidthsetWidth takes an integer and set it as the width of the chart svg. The chart gets redrawn and adjust all its dimensions including the bubble size, category group dimensions according to the new width automatically.
-
setHeightsetHeight takes an integer and set it as the height of the chart svg. The chart gets redrawn and adjust all its dimension including the bubble size, category group dimensions according to the new height automatically.