-
Notifications
You must be signed in to change notification settings - Fork 146
RubyMine Debugger Setup
Pre-requisite: RubyMine Project Setup
In order to debug Ruby code that runs inside of SketchUp we need to configure the debugging communication between SketchUp and the IDE.
Fetch the debugger dll/dylib from our GitHub repository: https://github.com/SketchUp/sketchup-ruby-debugger
Follow the instructions in the README for where to install the debugger library.
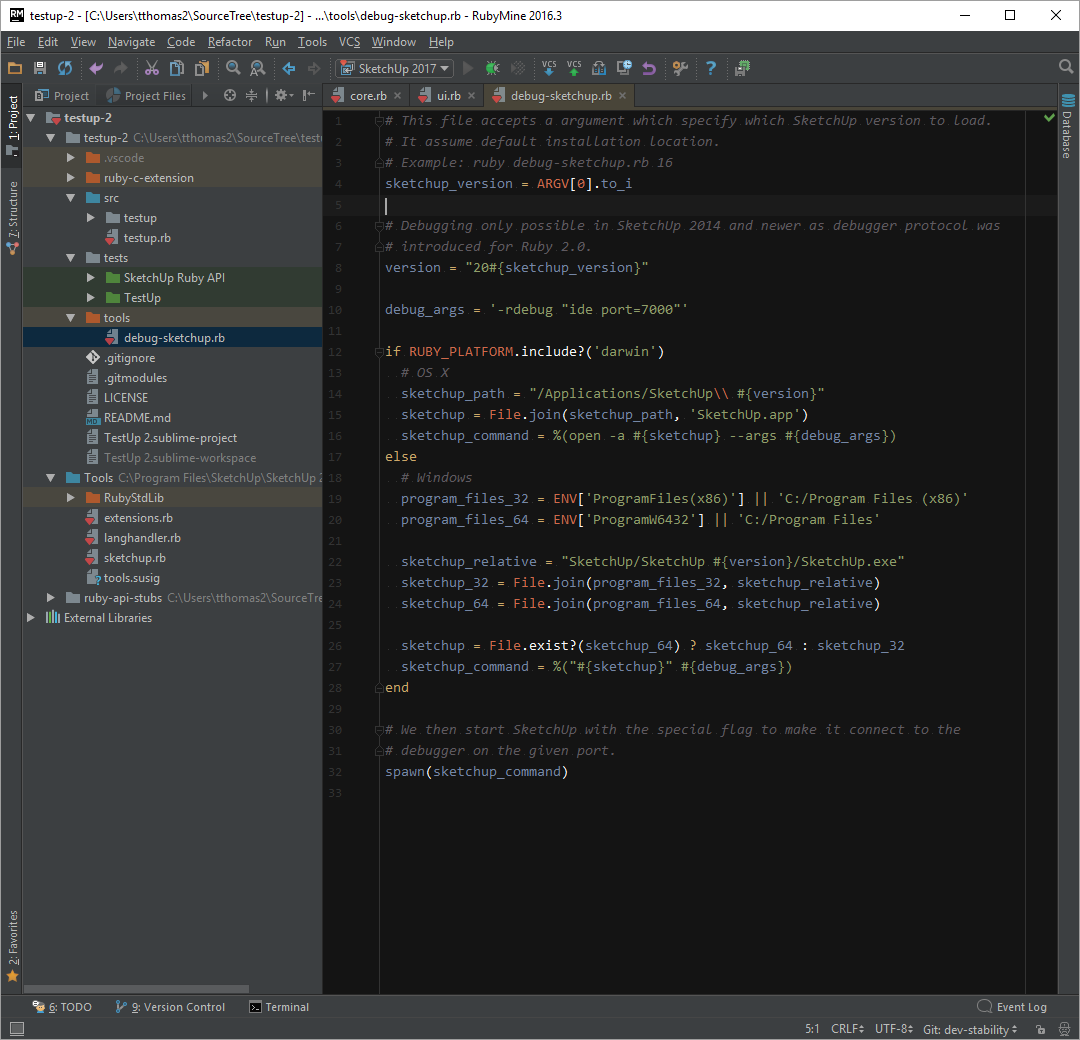
Next we can set up RubyMine. To allow RubyMine to launch SketchUp in debug mode we need the assistance of a little launcher script. (This require that you have standalone SketchUp installed on your system.)
We add a tools folder to the TestUp project folder where we can create a debug-sketchup.rb file:
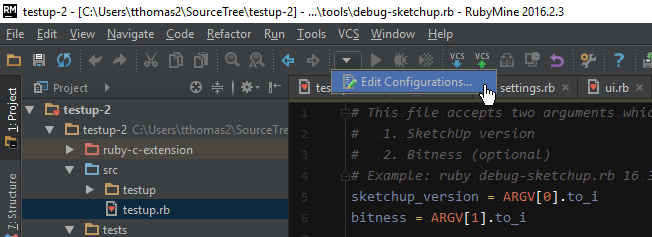
Now we configure the debug settings for the project; Run > Edit Configurations...
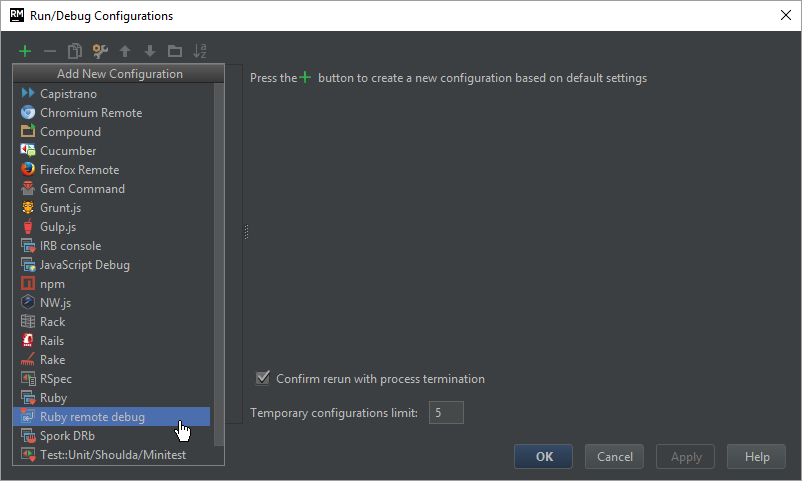
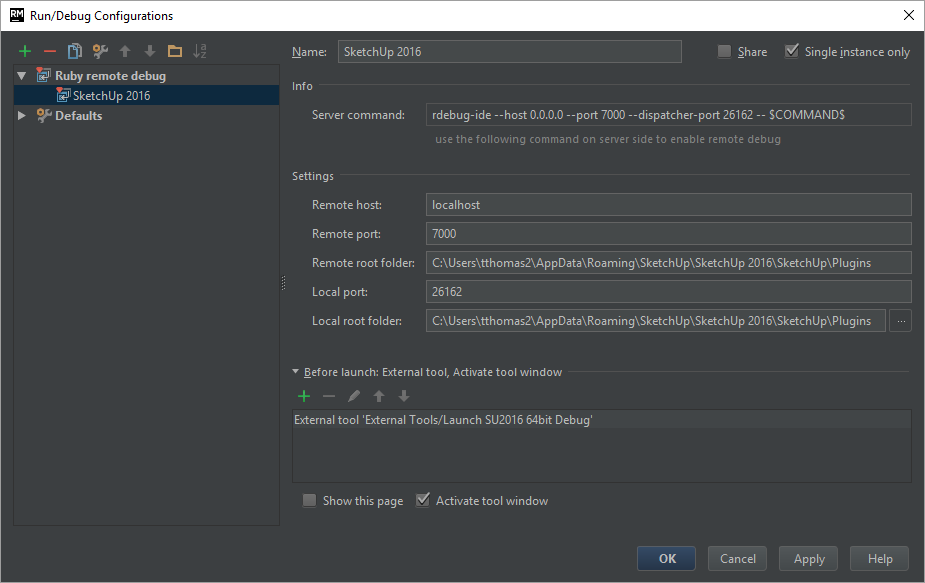
To debug Ruby within SketchUp we need to set up remote debugging:
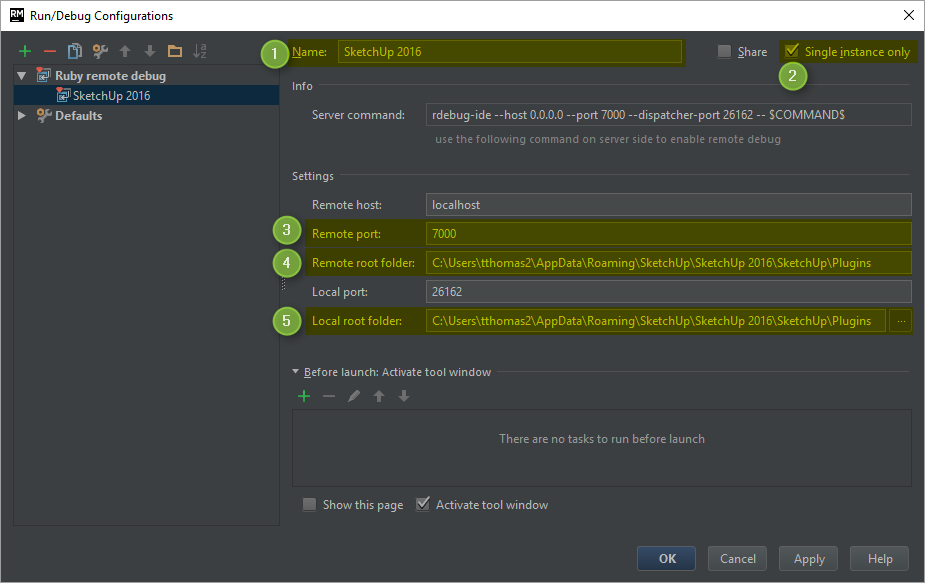
- The name will appear in the list of available debug configurations. You can set up multiple configurations if you need to debug in different SketchUp versions.
- RubyMine doesn't know if the SketchUp window have closed or not. So we tick the
Single instance onlysetting in order to ensure that RubyMine stops listening to previous debug runs if you should need to close and restart SketchUp during your debugging session. - Make sure the port matches the port you specify in your debug-sketchup.rb that launches SketchUp.
-
Remote root folderis set to the Plugins folder of the SketchUp installation you are debugging. - Ditto for
Local root folder.
Now we need to set up the debug config to launch SketchUp in debug mode. For that we set up an External Tool that RubyMine will launch when we start the debugging.
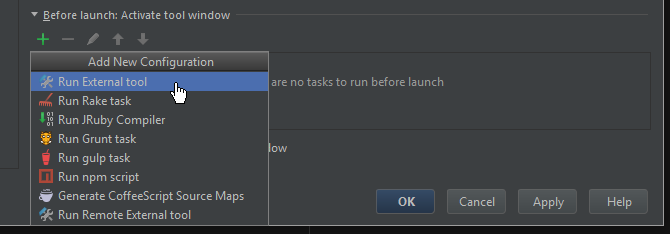
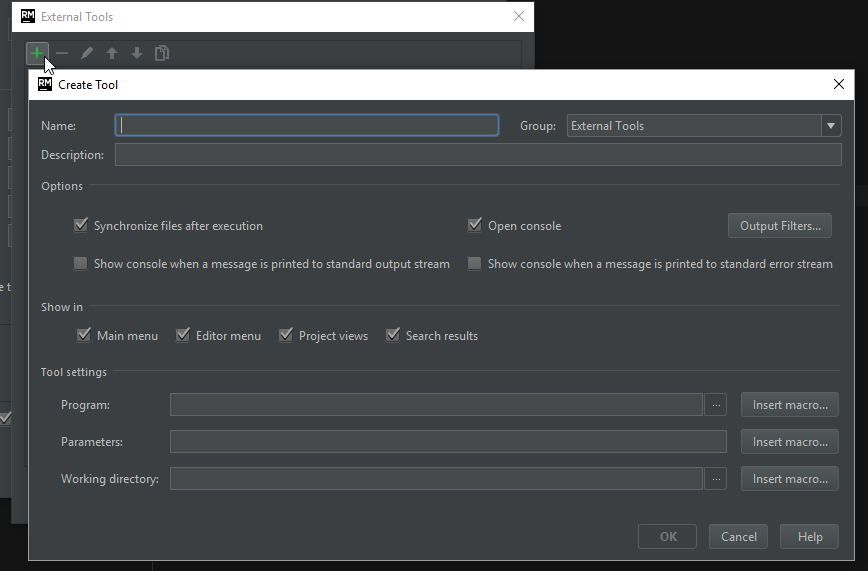
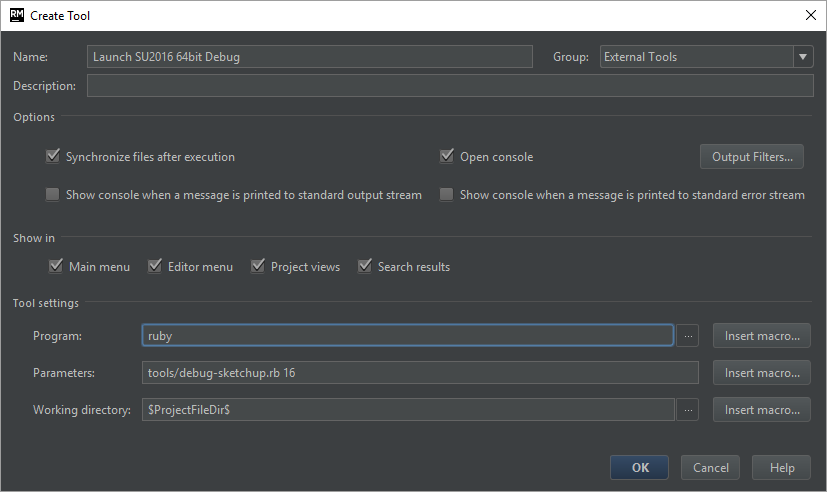
Here we configure RubyMine to run debug-sketchup.rb with a parameter that controls which SketchUp version we want to use.
Note we set the Working directory to be the project's path so that Ruby finds debug-sketchup.rb relative to the project. Otherwise you have to use a full path which makes the project less portable.
Our debug config should look something like this.
We can now start debugging. Pick the configuration from the Debug toolbar.

Once that is set you can use the Debug button to the right of the drop-down or from the Run menu.
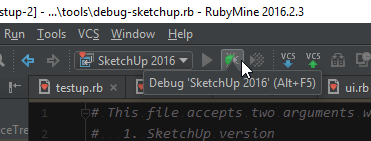
RubyMine will then start listening for SketchUp which is launched at the same time. When SketchUp is launched in debug mode it will appear frozen until a debugger client like RubyMine have connected.

After RubyMine have connected to SketchUp we can start stepping through code. Set breakpoints in the source code by clicking in the left gutter next to the line where you want to break:

Switch to SketchUp and exercise your extension. When we then trigger the breakpoint SketchUp will halt and you can step through the executing Ruby code using RubyMine.
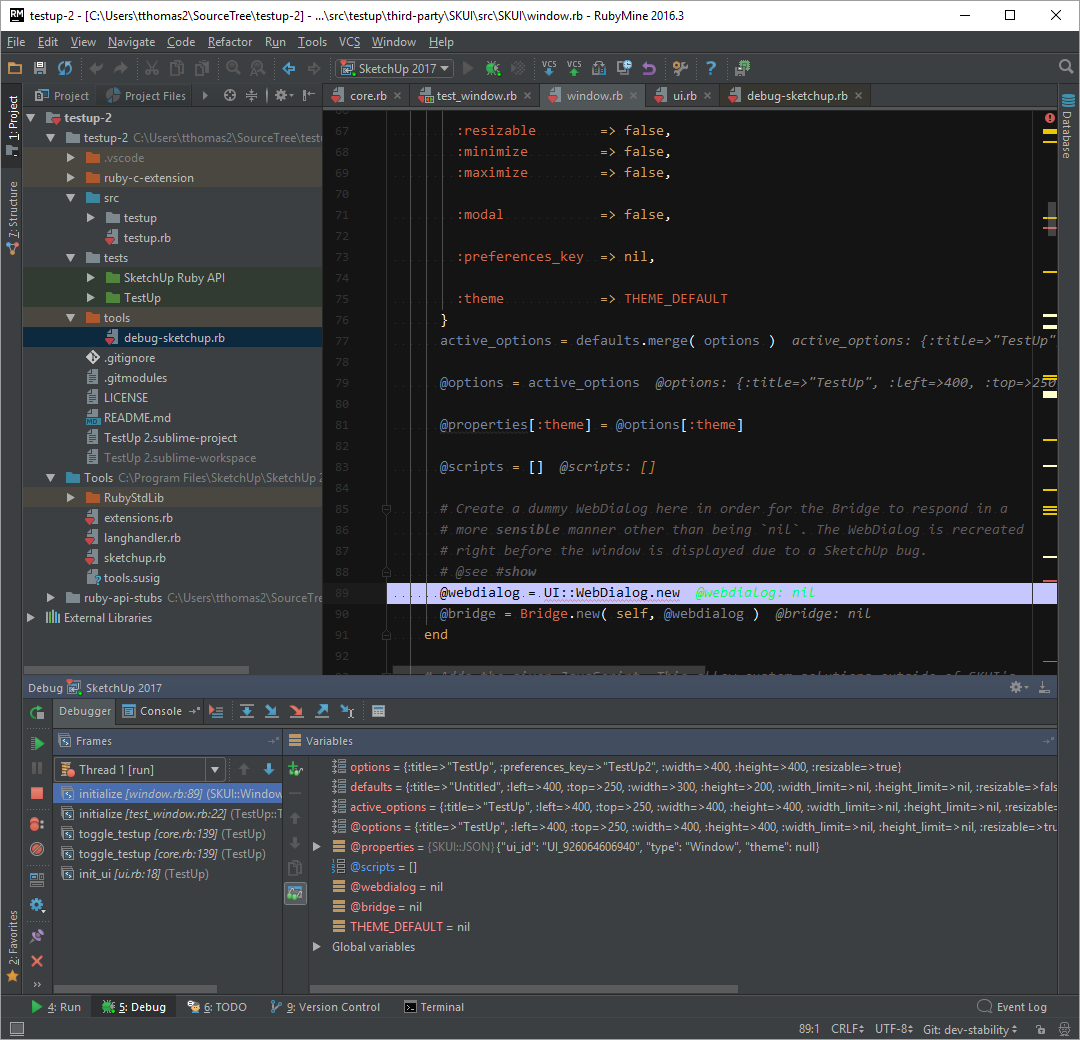
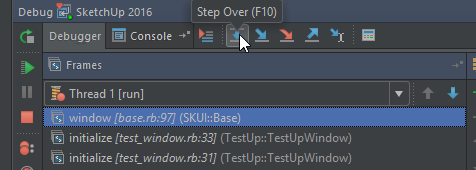
A debug panel will appear in RubyMine when you start debugging. One of the panels have controls that let you step through each line as its executed.
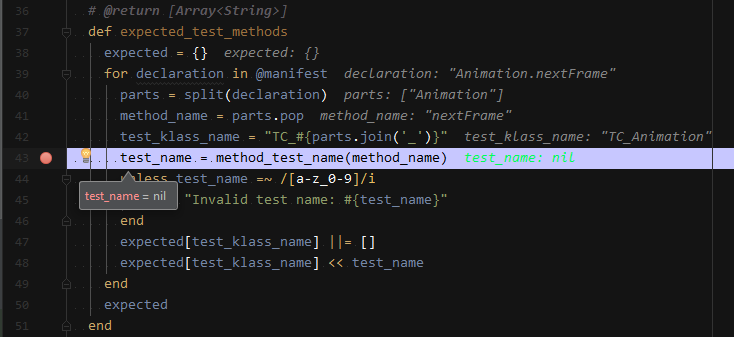
RubyMine will also show inline values for the variables in your source.
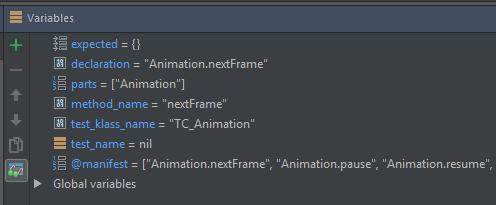
Additionally there is another panel that list all variables for the current scope.
If you close SketchUp you need to launch the debugger again. You will then be prompted with a message saying you already have a session open. This is because RubyMine doesn't know when SketchUp closes. Because we ticked Single instance only earlier it will ask us to stop the existing one. If you didn't check that option earlier you may experience that RubyMine isn't able to connect because the port is already busy.
