User Guide
This guide provides the essential information you can use to debug your code with BugQuery. It describes in detail the services BugQuery offers online and as a plug-in for Eclipse.
BugQuery's Eclipse plugin collects your program's stack trace, and helps you debug by automatically finding relevant solutions to your bugs online, using BugQuery's database. Additionally, the plugin marks lines in your code for quick access.
This section will help you install the plugin, and teach you how to use it.
To use this plug-in you must have Eclipse installed on your machine. The plug-in is supported in Eclipse Neon (which you can download from the Eclipse Foundation, we recommend Eclipse IDE for Java Developers).
To install the latest version of the BugQuery plugin, available in the Eclipse Marketplace, please follow the directions in User Guide: Plugin Installation.
First, locate BugQuery's menu in the Eclipse menubar. Click the arrow next to the main icon to select the project you want BugQuery to debug from the drop-down menu. This is necessary for marking lines in the correct project.

There are several methods you can use to debug with BugQuery. The plug-in will use whichever method you choose to retrieve the stack trace (which includes details about your execution), and then will display search results from our database in your default browser. BugQuery Markers will be added to the relevant lines in your code. After every launch you'll need to press the BugQuery button again (or to press Ctrl+6) in order to place the markers again in the right position.
With the BugQuery plug-in installed, you can choose from this selection of stack extraction methods:
-
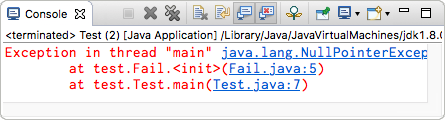
Extract the trace from a console. After an unsuccessful execution in Eclipse, the BugQuery plug-in can automatically isolate your program's stack trace from the console output. Note that you'll see the whole console output in the website, but behind the scene the trace is extracted. You can either press the BugQuery button shown above your console, or select the command's icon (
 ) in the BugQuery menu in the Eclipse menu bar. You can also use the keyboard shortcut
 ctrl+6(or⌘+6in macOS).
-
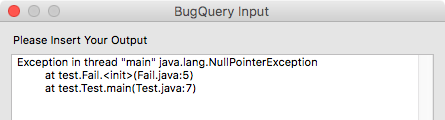
Input the trace yourself. If other methods fail, you can always initiate a BugQuery search with your own input. Add your query (your stack trace) to the system clipboard using your default copy or cut, and select
Trace from Clipboard( ) from the BugQuery toolbar. Alternatively, pick
 Trace from User Dialog( ) , and insert your query in the window that opens up. Click OK and you are set. You don't have to worry about formatting or adding unnecessary information - the plug-in faithfully extracts the important parts of your input.
Your browser will display the result page from the BugQuery website.

Lines in your code in which the error occurred will be marked, like so:

To see all the markers and navigate easily up and down the stack trace lines, go to Window, Show View, Other...

Select the Markers view from the list and click OK. The BugQuery markers appear under Trace Marker in this window.


Available at ssdlbugquery.cs.technion.ac.il, the website lets you interact with BugQuery online. Most notably, you can query the database with traces in our Submit page.

Additionally, you can find search results for common trace types in the website, and a list of all the trace types in BugQuery.