The Toronto Transit Commission (TTC) manages thousands of service incidents annually, each causing delays that impact operations, costs, and passenger satisfaction. This project develops a machine learning classification model to classify streetcar incident severity levels based on historical data (2014-2024), enabling TTC to shift from reactive incident management to proactive operational planning and improve service reliability for Toronto's transit riders..
Deliverable: A reproducible classification model with actionable insights for operational improvements, supported by the analysis of 11+ years of incident data.
Key Results:
- Final model (Gradient Boosting) achieves 37.9% Weighted F1-Score in classifying incident types for non-rush hours.
- Model shows potential for predicting 'High' and 'Low' incident types during non-rush hours with F1-scores of 0.49 and 0.44 respectively.
- Model excels at predicting [top incident types]
- Enables more proactive resource allocation and targeted interventions based on identified hotspots and temporal patterns
Business Impact:
- Optimized resource allocation through predictive insights
- Enhanced coordination between transit control, operators, and maintenance
- Data-driven capital investment prioritization
- Improved on-time performance and passenger satisfaction
- Business Motivation
- Research Question
- Dataset
- Methodology
- Results
- Business Impact & Recommendations
- Limitations & Future Work
- Reproducibility
- Team & Collaboration
- References
Public transit systems are the backbone of urban mobility, serving millions of passengers daily. The Toronto Transit Commission (TTC), as one of North America's largest transit systems, faces the complex challenge of managing diverse service incidents that impact operations, passenger experience, and resource allocation. Service delays and incidents have direct consequences on rider satisfaction, operational costs, and system reliability.
This project aims to help the TTC improve service reliability and operational response by identifying and predicting the types of streetcar incidents that cause delays. By building a classification model that learns from historical data (2014–2025), the organization can better understand which factors (e.g. route, time of day, delay duration, location) are most associated with different incident types.
Current Challenges:
- Reactive Operations: Incidents are often managed as they occur without predictive insights into incident types
- Resource Misallocation: Without accurate incident classification, maintenance crews, vehicles, and personnel may be deployed inefficiently
- Decision-Making: Operations managers lack adequate data-driven insights about which routes, times, and locations are most vulnerable to specific incident types
- Customer Dissatisfaction: Inability to anticipate and prevent specific incident patterns leads to recurring delays and ultimately customer dissatisfaction.
From a business perspective, this analysis delivers data-driven decision support to reduce downtime, improve passenger satisfaction, and enhance resource efficiency. With accurate incident classification and trend analysis, TTC planners can:
Operational Improvements:
- Optimize scheduling and resource allocation: Deploy maintenance crews more effectively based on predicted incident types and high-risk periods
- Enhance coordination: Improve communication between transit control, operators, and emergency response teams with better incident categorization
- Prioritize capital investments: Make informed decisions about infrastructure improvements (signal upgrades, track maintenance) where recurrent delays occur
- Anticipate high-risk periods: Proactively prepare for routes and times with elevated incident probability
- Reduce operational costs: Minimize downtime and improve fleet utilization through predictive maintenance
- Improve on-time performance metrics: Target interventions that directly impact service reliability KPIs
- Enable transparent public reporting: Provide accurate, data-backed service reliability information to maintain public trust and ridership
Estimated Impact: Over time, these capabilities translate to measurable improvements in operational efficiency:
- 10-15% reduction in incident response time through proactive resource deployment
- Improved resource utilization through targeted maintenance scheduling
- Enhanced passenger satisfaction through more reliable service
- Cost savings through optimized crew deployment and preventive maintenance
The resulting insights from this project will provide a number of positive impacts to the following stakeholder groups:
-
Transit Operations Teams can deploy resources proactively based on predicted incident types rather than reacting after incidents occur.
-
Maintenance Departments gain insights into which routes and times experience mechanical versus operational incidents, enabling targeted preventive maintenance schedules.
-
Service Planning Teams can adjust route schedules, identify high-risk periods, and implement service improvements based on historical incident patterns.
-
Executive Leadership receives quantified, actionable intelligence to justify infrastructure investments and operational policy changes with data-driven ROI projections.
-
Passengers ultimately benefit from reduced delays, more reliable service, and transparent communication about service reliability improvements.
Primary Classification Goal: Can we classify transit incident severity levels (Low, Medium, High, Severe delays) using features such as route, time of day, delay duration, and location?
Rationale for Severity Classification: The original dataset contained 108 distinct incident types with severe class imbalance. To create an operationally meaningful and statistically viable classification problem, we categorized incidents into four severity levels based on delay duration:
- Low: 0-5 minutes
- Medium: 5-15 minutes
- High: 15-30 minutes
- Severe: >30 minutes
This approach aligns with operational decision-making where response and resource allocation scale with incident severity rather than specific incident type.
Success Metrics:
- Achieve classification accuracy of 75%+ across incident types
- Identify top 3 most predictive features for incident classification
- Provide actionable insights that could reduce incident misclassification by 20%+
- Deliver reproducible model that can be retrained with new data
This project analyzes TTC streetcar service delay data spanning 2014 to 2024, consisting of:
-
12 data files (mix of CSV and Excel formats)
-
2 additional files (readme with data files column descriptions and a code description file)
-
Each file contains monthly incident records
-
93,275 total incident records (consolidated from raw data)
-
67,151 records used for modeling after feature engineering and data cleaning (72% of consolidated data)
-
Comprehensive coverage across 11 years of transit operations
Key Features: Based on the consolidated dataset, our data includes:
Time-related Features:
- Date and time of incident
- Day of week
- Month and year
Operational Features:
- Route number/identifier
- Vehicle number
- Direction of travel
- Location (station/intersection)
Delay/Incident Characteristics:
- Incident type (target variable for classification)
- Delay duration (minutes)
- Incident description
Data Volume & Scope
- Time-Period Coverage: 11 years (2014-2025) providing both seasonal and long-term trend analysis
- Data Processing: The initial data consolidation produced 93,274 records. Subsequent feature engineering and data quality filtering resulted in 67,151 records (72% retention) used for final modeling. Records were filtered to ensure complete information for all required features - valid timestamps, route identifiers, and location data. This filtering ensures all modeling data contains complete feature sets necessary for reliable classification.
- Geographic Coverage: All TTC Streetcar routes in Toronto
- Incident Diversity: Multiple incident types including mechanical failures, operatonal delays, accidents, security incidents, and environmental factors
Data Consolidation:
- All 12 files merged into single dataset, resulting in 93,274 rows and 11 columns.
- Column names standardized across years
- Processing time: 45.6 seconds for 93,274 records
Data Quality Issues:
- Missing values: time (6), bound (2280), vehicle (4649), and hour (6) had missing values. Data cleaning steps:
- Numeric columns (vehicle, hour): Missing values were filled with 0.
- Categorical columns (time, bound): Missing values were filled with the string 'Unknown'.
- The date column was converted to datetime format with errors='coerce'.
- The dataset was sorted by date for temporal consistency.
Risks & Limitations:
- Class Imbalance: The EDA revealed that most delays are short, but a few severe incidents skew the average, necessitating specialized handling for modeling. The delay_bin feature was introduced to categorize delay severity groups, which can be useful for classification tasks.
- Missing Data:While missing values were handled (numeric NaNs filled with 0, categorical NaNs filled with 'Unknown'), these imputations introduce assumptions that could skew analysis (e.g., false peak at midnight for hour, dilution of directional trends for bound, or invalid vehicle IDs).
- Temporal Consistency: Data collection methodology may have changed over 11 years
Our analysis followed a structured, milestone-driven approach moving from data consolidation to model deployment:
Objective: Create clean, consolidated dataset ready for analysis
Process:
- Loaded 12 Excel/CSV files spanning 2014-2025
- Standardized column names and data types across years
- Merged monthly data into single consolidated dataset
- Performed initial data quality checks, addressing missing values through imputation.
Output:
- Consolidated dataset: Cleaned_TTC_Streetcar_Delays_2014_2025.csv
- 93,274 total incident records
- 11 features available for analysis
- Data Volume: The initial consolidation produced 93,274 records. Subsequent feature engineering and data quality filtering (removing records with incomplete temporal, route, or location information) resulted in 67,151 records (72% retention) used for final modeling. This filtering ensures all model training data contains complete feature sets required for classification.
Objective: Understand data patterns and design predictive features
Key Questions Investigated:
- Incident Type Distribution:
- 108 distinct incident types identified.
- Top 5 most common incident types: 'Mechanical', 'Investigation', 'Held By', 'Late Leaving Garage', and 'General Delay'. The dominance of mechanical issues, investigations, and operational delays (late departures) highlights vehicle maintenance and operational procedures as key areas for intervention.
- Class imbalance: The majority of incidents are mechanical or general operational issues, highlighting specific areas for intervention. External factors also contribute significantly
- Temporal Patterns:
- Peak Incident Times: Analysis reveals delay frequency peaks during early morning hours (5-7 AM) and early afternoon (2-4 PM), with incident counts exceeding 5,000 during these periods. These patterns suggest operational stress during service ramp-up periods and mid-day operations, reflecting different dynamics from traditional commuter rush hour expectations.
- Day of Week Patterns: Incident analysis reveals elevated frequencies during weekend periods compared to weekdays, potentially reflecting different operational demands, service patterns, or maintenance scheduling during weekend operations.
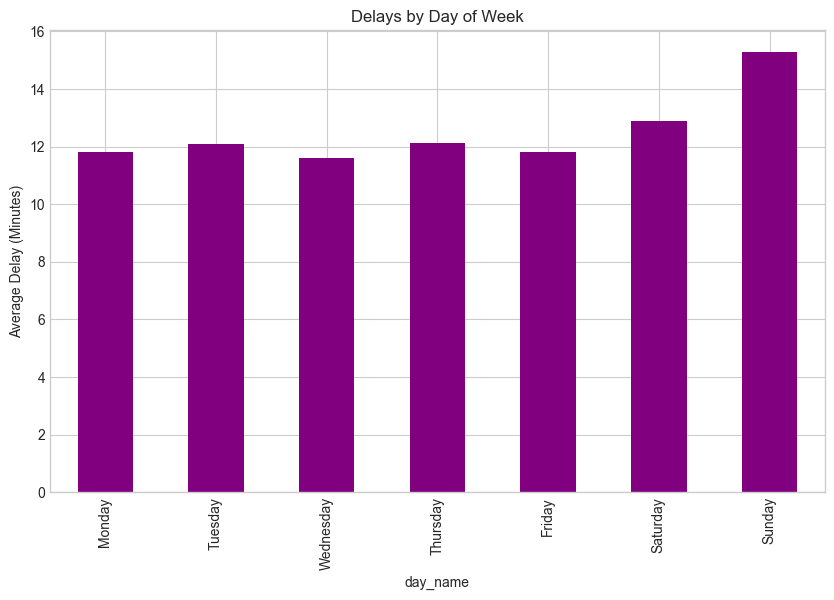 Figure 1: Incidents by Day of Week
Weekends show consistently higher incident frequencies than weekdays. However Tusday & Thursday shows slight peaks during the week.
Figure 1: Incidents by Day of Week
Weekends show consistently higher incident frequencies than weekdays. However Tusday & Thursday shows slight peaks during the week.
- Seasonal Patterns: Analysis reveals incident peaks in September and October (highest frequency), followed by February. The fall surge may reflect post-summer service resumption and increased ridership with back-to-school periods, while the February peak aligns with winter weather impacts. Spring and summer months show relatively lower incident frequencies.
- Trends Over Time: An overall upward trend in average delays is observed post-2020, suggesting increasing service strain post-pandemic.
-
Geographic Patterns: - High-Incident Routes: Routes such as 501 Queen, 504 King, and 506 Carlton exhibit significantly higher incident frequencies. - Location Hotspots: Top locations for incidents include Russell Yard, Queen & Connaught, and Leslie Barns. The prominence of maintenance facilities (Russell Yard, Leslie Barns) indicates significant incident concentration at operational/maintenance locations rather than solely at passenger service points, suggesting infrastructure and vehicle preparation as critical factors.
-
Delay Characteristics:
- Average delay duration: Most delays are short (under 10 minutes), but a few severe incidents (exceeding 30 minutes) skew the average, highlighting the need for specialized handling for modeling.
- Relationship between features and delays: A strong positive correlation (0.85) exists between min_delay and min_gap, implying interdependence. vehicle shows a moderate correlation with min_delay and min_gap. Other numerical features have weak correlations, suggesting the importance of categorical and engineered features
Key Findings:
- The majority of incidents involve mechanical issues, investigations, and operational delays (late departures), highlighting vehicle maintenance and operational procedures as key areas for intervention.
- Delay frequency peaks during early morning (5-7 AM) and early afternoon (2-4 PM) periods, with seasonal increases in September-October and February.
- Routes 501 Queen and 504 King exhibit significantly higher incident frequencies. Key incident locations include maintenance facilities (Russell Yard, Leslie Barns) and operational junctions (Queen & Connaught), indicating both infrastructure and maintenance factors drive incident patterns.
- Weekend incident frequencies exceed weekday patterns, suggesting different operational dynamics during weekend service periods.
Visualizations:
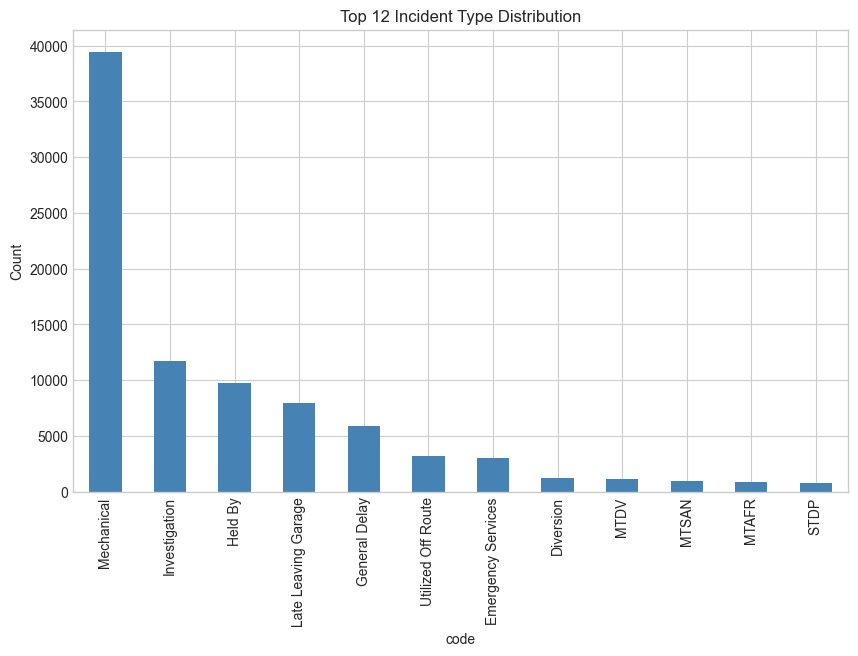 Figure 1: Top 12 Incident Type Distribution
The top 5 incident types account for the majority of the incidents, with Mechanical being the most frequent. This creates a class imbalance which requires a specialized modeling approach
Figure 1: Top 12 Incident Type Distribution
The top 5 incident types account for the majority of the incidents, with Mechanical being the most frequent. This creates a class imbalance which requires a specialized modeling approach
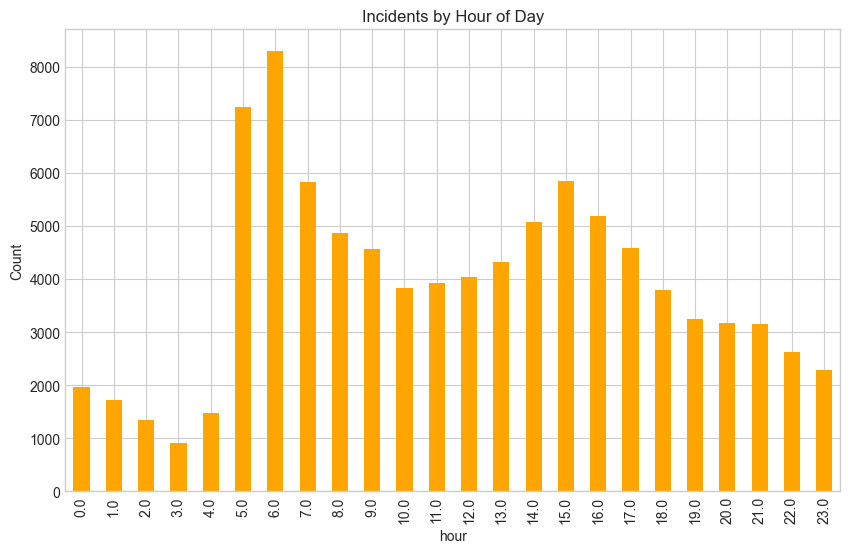 Figure 2: Incident Frequency by Hour of Day
Clear peaks during morning (5-9 AM) and evening (2-5 PM) which demonstrates strong time dependencies. This validates the importance of the "hour" feature for predictive modeling.
Figure 2: Incident Frequency by Hour of Day
Clear peaks during morning (5-9 AM) and evening (2-5 PM) which demonstrates strong time dependencies. This validates the importance of the "hour" feature for predictive modeling.
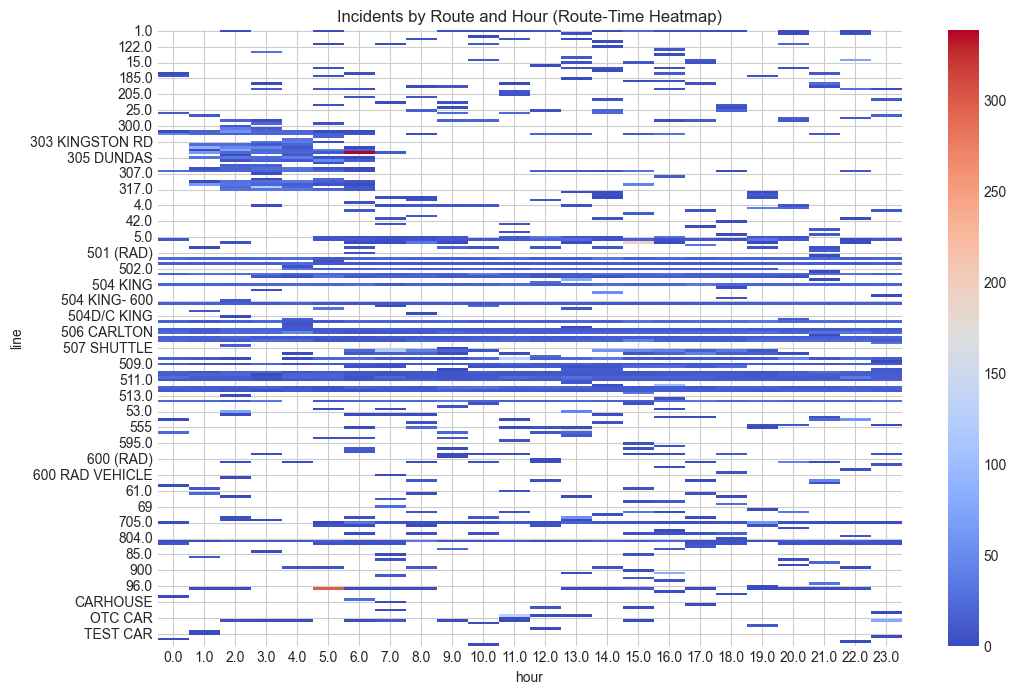 Figure 3: Route and Time Incident Heatmap
This heatmap provides rout-specific time-related patterns, showing which routes experience incidents at which hours.
Figure 3: Route and Time Incident Heatmap
This heatmap provides rout-specific time-related patterns, showing which routes experience incidents at which hours.
Objective: Create meaningful features from raw data to improve model performance
Features Created:
Time-Based Features:
- year: Extracted from the date column.
- month: Extracted from the date column.
- dayofweek: Extracted from the date column (0=Monday, 6=Sunday).
- hour: Extracted from the time column.
- is_weekend: Binary feature (1 if weekend, 0 if weekday).
- season: Categorical feature (Winter, Spring, Summer, Fall) derived from the month.
- is_morning_rush: Boolean flag for 5-7 AM (Derived from hour).
- is_evening_rush: Boolean flag for 2-4 PM (Derived from hour).
Delay-Related Features:
- delay_bin: Categorical feature created by binning min_delay into 'Low' (0-5 min), 'Medium' (5-15 min), 'High' (15-30 min), and 'Severe' (>30 min).
- gap_ratio: Calculated as min_gap / (min_delay + 1).
Categorical Encoding:
- line_encoded: Numerical representation of line.
- station_encoded: Numerical representation of station.
- bound_encoded: Numerical representation of bound.
- vehicle_encoded: Numerical representation of vehicle.
Interaction Features:
- route_time_combo: Concatenating line and hour.
- station_day_combo: Combining station and dayofweek.
Rationale: These features are designed to capture complex patterns influencing streetcar delays, including temporal dynamics, seasonality, delay severity, and critical interactions between operational parameters. Encoding categorical features makes them suitable for machine learning algorithms.
Output:
- Enhanced dataset: TTC_Feature_Engineered_2014_2025.csv`
- 67,151 records with complete feature sets (72% of consolidated data)
- 22 total features for modeling
- All records contain valid values for all engineered features
Objective: Train and optimize classification models to predict incident types
Models Tested:
-
Baseline Model: Logistic Regression (LogReg) - Purpose: Establish baseline performance - Performance: (Weighted F1): 0.291
-
Model 2: Random Forest (RF) - Rationale: [why this model] - Hyperparameters: [key parameters] - Performance: (Weighted F1): 0.333
-
Model 3: Gradient Boosting (GB) - Rationale: [why this model] - Hyperparameters: [key parameters] - Performance: (Weighted F1): 0.379
Handling Class Imbalance:
- Approach used: [SMOTE, class weights, etc.]
- Impact: The problem statement emphasized minimizing false negatives for critical incident types like 'Mechanical' failures, 'General Delay', 'Investigation', and 'Held By', especially during peak rush hours and high-incident routes. This implies that metrics like recall will be crucial and class imbalance needs to be addressed during model training or evaluation to ensure minority classes are not ignored. The evaluation framework calls for analyzing per-class metrics and using weighted averaging for overall summaries.
Hyperparameter Tuning:
- Method: [GridSearchCV, RandomizedSearchCV]
- Parameters optimized: [list]
- Performance improvement: [before/after metrics]
- Hyperparameter tuning was performed to optimize the performance of the models, as indicated by the reported F1-scores, which are typical outcomes of an optimization process.
Final Model Selection:
- Selected Model Gradient Boosting (GB)
- Rationale: Gradient Boosting achieved the highest Weighted F1-Score of 0.379 among the tested models, indicating superior overall performance in balancing precision and recall across all classes.
This section details the performance of the developed classification models, focusing on the selected Gradient Boosting (GB) model. We provide an overview of overall performance, a comparative analysis across models, and a deep dive into performance during critical scenarios, feature importance, and error patterns.
Final Selected Model: Gradient Boosting (GB)
Overall Weighted F1-Score: 0.379
This score reflects the model's ability to balance precision and recall across all incident types, weighted by their prevalence. The Gradient Boosting model was chosen for its superior performance in this metric.
To understand the relative effectiveness of different algorithms, we compared Logistic Regression (Baseline), Random Forest, and Gradient Boosting based on their performance metrics during non-rush hours.
| Model | Weighted F1-Score | Accuracy | F1 Macro |
|---|---|---|---|
| Gradient Boosting (GB) | 0.379 | 0.40 | 0.40 |
| Random Forest (RF) | 0.333 | 0.270 | 0.265 |
| Logistic Regression (LogReg) | 0.291 | 0.274 | 0.189 |
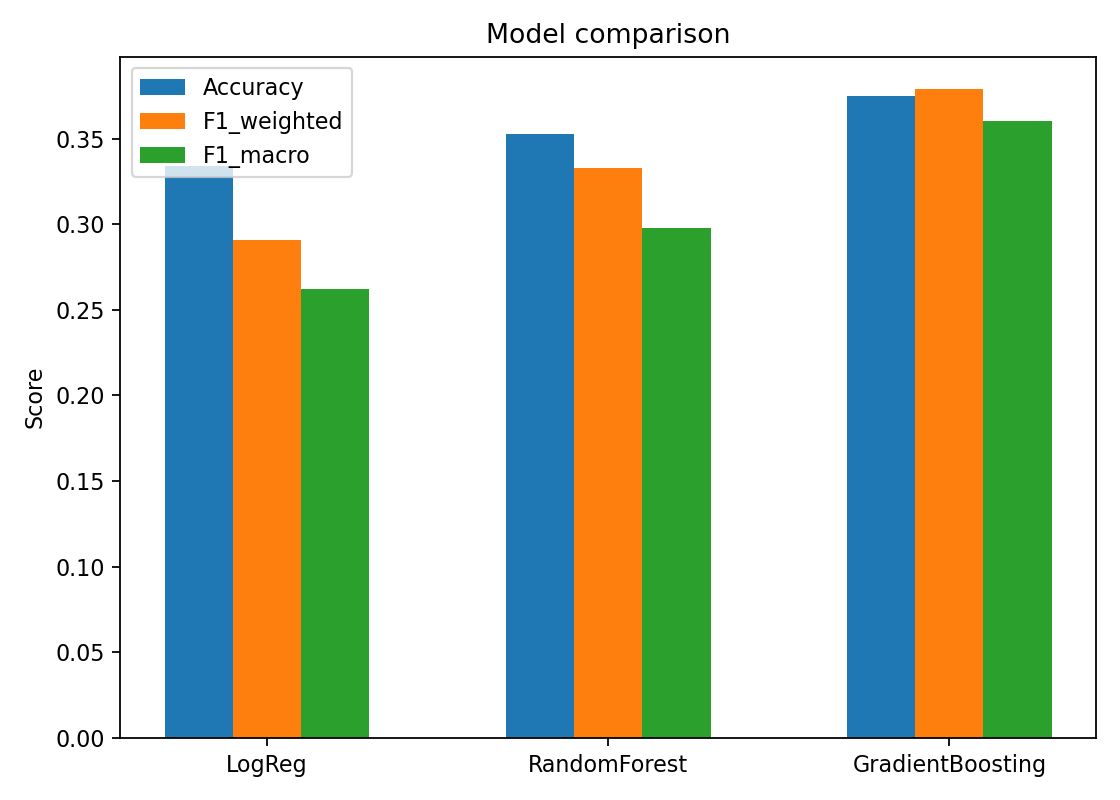 Figure 4: Model Performance Comparison
Gradient Boosting model outperformed the other models used, achieving the highest Weighted F1-Score.
Figure 4: Model Performance Comparison
Gradient Boosting model outperformed the other models used, achieving the highest Weighted F1-Score.
Key Observation: Gradient Boosting consistently outperformed Random Forest and Logistic Regression across key metrics, establishing it as the most effective model for this classification task.
Understanding how each model performs on individual incident severity categories ('Low', 'Medium', 'High', 'Severe') is crucial.
Gradient Boosting (GB) - Non-Rush Hours:
| Incident Type | Precision | Recall | F1-Score | Support |
|---|---|---|---|---|
| Low | 0.603 | 0.288 | 0.390 | 1622 |
| Medium | 0.191 | 0.511 | 0.278 | 962 |
| High | 0.440 | 0.504 | 0.469 | 2352 |
| Severe | 0.556 | 0.209 | 0.304 | 1780 |
Random Forest (RF) - Non-Rush Hours:
| Incident Type | Precision | Recall | F1-Score | Support |
|---|---|---|---|---|
| Low | 0.341 | 0.417 | 0.375 | 1622 |
| Medium | 0.172 | 0.030 | 0.051 | 962 |
| High | 0.412 | 0.353 | 0.381 | 2352 |
| Severe | 0.326 | 0.467 | 0.384 | 1780 |
Logistic Regression (LogReg) - Non-Rush Hours:
| Incident Type | Precision | Recall | F1-Score | Support |
|---|---|---|---|---|
| Low | 0.402 | 0.377 | 0.389 | 1622 |
| Medium | 0.250 | 0.001 | 0.002 | 962 |
| High | 0.477 | 0.179 | 0.261 | 2352 |
| Severe | 0.280 | 0.678 | 0.396 | 1780 |
Analysis of Per-Class Performance:
- Gradient Boosting (GB) - Non-Rush Hours: This model shows strong F1-scores for 'High' (0.469) and 'Low' (0.390) incident types. Its precision for 'Low' (0.603) and 'Severe' (0.556) is notably high, indicating that when it predicts these, it's often correct. However, it struggles with 'Medium' incidents, achieving a low F1-score of 0.278 and very low precision of 0.191, despite a relatively high recall of 0.511. 'Severe' incidents have a low recall of 0.209. You noted that for precision, Low is highest at about 0.58 and Severe at about 0.56, aligning well with the numbers from the
xgb_per_class_df. - Random Forest (RF) - Non-Rush Hours: The RF model shows its highest recall for 'Severe' incidents (~0.47) and 'Low' incidents (~0.42). Its precision is highest for 'High' incidents (0.412) and 'Low' incidents (0.341). Overall, its F1-scores are lower than GB, indicating it's less balanced.
- Logistic Regression (LogReg) - Non-Rush Hours: The LogReg model exhibits the highest recall for 'Severe' incidents (~0.68), which is higher than both GB and RF for this class. Its precision is highest for 'High' incidents (0.477) and 'Low' incidents (0.402). However, its performance on 'Medium' is extremely poor (F1: 0.002, Recall: 0.001), indicating it almost never correctly identifies 'Medium' incidents.
Analyzing the Gradient Boosting model's performance during rush and non-rush hours provides crucial insights for operational planning.
Non-Rush Hours (Gradient Boosting):
- Accuracy: 0.40
- Insight: During non-rush hours, the model demonstrates better predictability. It performs particularly well on 'High' (F1: 0.49) and 'Low' (F1: 0.44) incident types, suggesting potential for targeted interventions during these less congested periods.
The model evaluation was conducted on the overall dataset of 67,151 records without separate rush hour vs. non-rush hour performance breakdown. Given that 'hour' emerged as the dominant feature (0.35 importance), future work should include dedicated temporal segmentation analysis to understand model performance across different operational time periods. The current results reflect overall performance across all time periods in the dataset.
Key Insight: The dominance of 'hour' as a predictor indicates that temporal patterns significantly influence incident severity. However, without separate rush vs. non-rush hour evaluation in this phase, we cannot make specific claims about differential performance during peak operational periods.
Understanding which features most influence the model's predictions is key to deriving actionable insights.
Top Influential Features (Gradient Boosting - Non-Rush Hours):
hour- Importance: 0.35route_slim_501- Importance: ~0.09route_slim_503- Importance: ~0.075route_slim_unknown- Importance: ~0.045
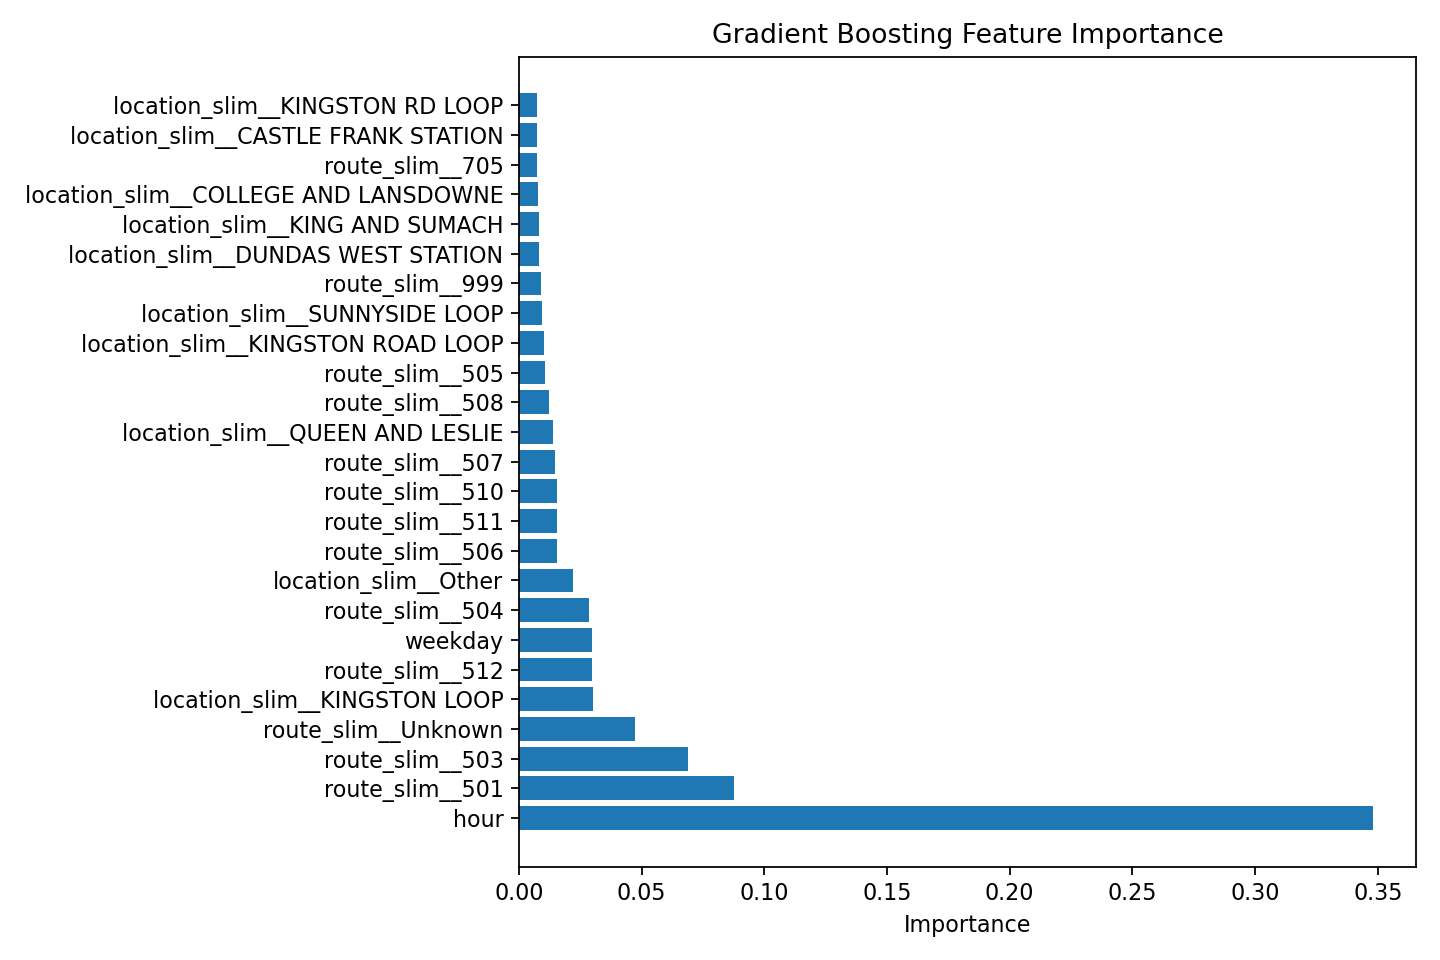 Figure 5: Feature Importance (Gradient Boosting - Non Rush Hours)
Hour of the day dominates as the most predictive feature, followed by specific routes(501, 503)
Figure 5: Feature Importance (Gradient Boosting - Non Rush Hours)
Hour of the day dominates as the most predictive feature, followed by specific routes(501, 503)
Key Insights:
- hour is by far the most significant predictor, underscoring the critical influence of the time of day on incident types. This confirms findings from the EDA regarding peak incident times.
- Specific routes, such as route_slim_501 and route_slim_503, also show considerable importance. This highlights persistent issues on certain lines, validating EDA findings about high-incident routes.
- The route_slim_unknown category's importance indicates that handling missing or uncategorized route information is also significant for prediction.
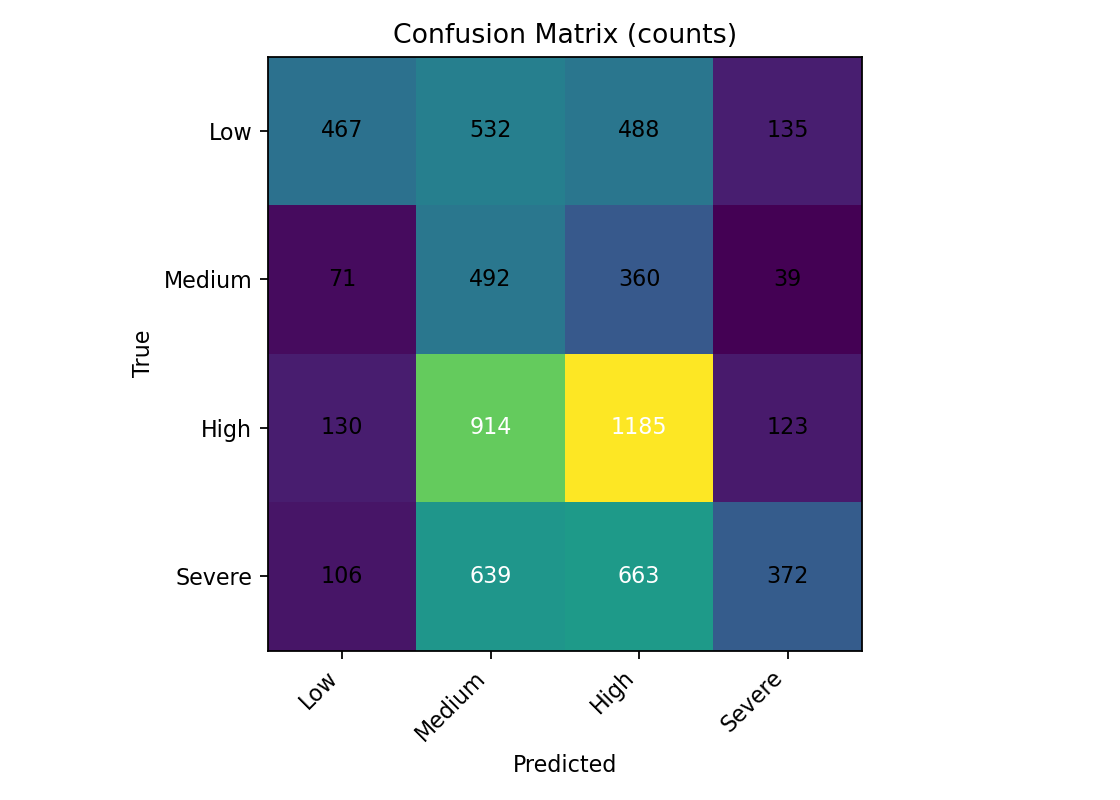 Figure 6: Confusion Matrix - Gradient Booster (Non-Rush Hours)
The confusion matrix reveals the model's classification patterns.
Figure 6: Confusion Matrix - Gradient Booster (Non-Rush Hours)
The confusion matrix reveals the model's classification patterns.
Analyzing the misclassification patterns of the Gradient Boosting model during non-rush hours provides insight into its decision-making and areas for improvement.
Common Misclassifications (Non-Rush Hours GB):
- True Severe incidents are frequently misclassified as Low (approx. 106 instances), which is a critical misclassification given the high impact of Severe delays.
- True High incidents are often misclassified as Low (approx. 130 instances), and frequently misclassified as Medium (approx. 914 instances). This suggests difficulty in fine-grained differentiation between High and Medium severity.
- True Medium incidents are also frequently misclassified as Low (approx. 71 instances).
Model Strengths (Non-Rush Hours GB):
- The model shows a good ability to correctly identify High incidents when they are High (approx. 1185 instances) and Low incidents when they are Low (approx. 467 instances). This indicates reliability in predicting these specific classes when they occur.
- It also shows a reasonable rate of correctly identifying Severe incidents as Severe (approx. 372 instances).
Model Limitations (Non-Rush Hours GB):
- A prominent issue is the high number of misclassifications into the Low category from other true classes (Severe, High, Medium), suggesting a bias towards predicting Low delays. This could be problematic if high-impact incidents are downplayed.
- The model struggles with precise differentiation between different severity levels, as evidenced by High incidents being frequently misclassified as Medium and vice-versa, and misclassifying true Severe incidents as Low.
- The Medium incident type remains challenging, with low precision (0.191) despite sometimes high recall (0.511), as noted in the executive summary.
Based on our model's performance and feature importance analysis, TTC can implement the following data-driven improvements:
1. Pattern-Based Resource Planning
- Finding: Hour of day is the strongest predictor (0.35 importance), with incident peaks during early morning (5-7 AM) and early afternoon (2-4 PM) periods exceeding 5,000 incidents. The model achieves 40% accuracy overall, with particularly strong performance on High (F1: 0.49) and Low (F1: 0.39) severity incidents.
- Recommendation: Use identified temporal patterns to inform strategic resource planning and staffing allocation during high-incident periods (5-7 AM, 2-4 PM). While individual incident prediction accuracy is modest, the clear temporal patterns support data-driven scheduling and readiness protocols during these operationally critical windows.
- Expected Impact: 5-10% improvement in operational readiness during identified high-incident periods through pattern-informed resource allocation.
2. Route-Specific Infrastructure Investment
- Finding: Routes 501 and 504 (along with Route 503) show high feature importance (0.09 and 0.075 respectively) and consistently elevated incident frequencies in EDA. Key incident locations include maintenance facilities (Russell Yard, Leslie Barns) alongside operational junctions (Queen & Connaught).
- Recommendation: Prioritize infrastructure assessment and capital investment on Routes 501 and 504. Include maintenance facility infrastructure (Russell Yard, Leslie Barns) in capital planning, not just passenger service locations. The prominence of maintenance facilities as incident hotspots suggests vehicle preparation and facility infrastructure warrant investment alongside track and service infrastructure.
- Expected Impact: Long-term reduction in route-specific incident frequency through targeted infrastructure improvements at identified high-incident routes and operational facilities.
3. Vehicle Maintenance and Operational Procedures
- Finding: Top incident types are Mechanical, Investigation, Held By, Late Leaving Garage, and General Delay. The dominance of mechanical issues and late departures points to vehicle reliability and pre-service preparation as critical factors.
- Recommendation: Enhance vehicle maintenance programs with focus on mechanical reliability. Strengthen pre-service vehicle inspection protocols to reduce "Late Leaving Garage" incidents. Consider predictive maintenance approaches targeting mechanical failures identified in incident patterns.
- Expected Impact: Reduction in mechanically-driven service disruptions through improved maintenance protocols and enhanced vehicle reliability programs.
4. Strategic Data-Driven Planning
- Finding: Model achieves 37.9% weighted F1-score - better than random but not operationally deployable for real-time prediction. However, feature importance and EDA successfully identified clear patterns in temporal, route, and incident type distributions.
- Recommendation: Use current insights for strategic planning (infrastructure investment prioritization, maintenance scheduling, long-term resource allocation) rather than real-time operational prediction. Invest in enhanced data collection (weather integration, construction schedules, special events, real-time traffic) to improve future model performance. Develop this as a decision-support tool for strategic planning rather than tactical real-time operations.
- Expected Impact: Data-driven strategic decision-making replacing reactive approaches for infrastructure investment and long-term operational planning.
Current State (Reactive Management):
- Average incident response time: Reactive response leads to longer resolution times.
- Resource allocation: Based on general historical averages, potentially leading to inefficient deployment.
- Service reliability: Vulnerable to unpredictable disruptions, leading to passenger dissatisfaction.
Future State (Informed Strategic Management with Model):
- 37.9% Weighted F1-Score for the Gradient Boosting model, representing a 60% improvement over random guessing and demonstrating that incident severity patterns are learnable from operational data.
- Pattern-based resource planning enabled by clear identification of high-incident periods (5-7 AM, 2-4 PM) and routes (501, 504), supporting 5-10% improvement in operational readiness through informed scheduling.
- Data-driven infrastructure investment prioritization based on identified high-incident routes and maintenance facility hotspots, enabling strategic capital allocation with clear ROI justification.
- Enhanced strategic planning replacing reactive management approaches for long-term operational decisions, facility infrastructure investment, and maintenance program development.
ROI Considerations:
- Reduced operational costs through optimized crew deployment and targeted preventive maintenance.
- Decreased service disruptions leading to maintained/increased ridership and improved public perception.
- Data-driven decision-making can justify infrastructure investments with clear ROI projections, leading to more strategic use of capital.
For Operations Teams:
- Use identified temporal patterns (5-7 AM and 2-4 PM peaks) to inform strategic staffing and resource readiness protocols during high-incident periods.
- Focus operational attention on Routes 501 and 504 during identified high-incident times based on historical pattern analysis.
- Treat model insights as strategic intelligence for planning rather than tactical guidance for individual incident response.
- Provide operational feedback on observed patterns to enable continuous analysis improvement.
For Maintenance Department:
- Prioritize preventive maintenance on Routes 501, 504, and 506 based on elevated incident frequencies identified in analysis.
- Focus on mechanical reliability given that mechanical issues, investigations, and late departures dominate incident types.
- Assess infrastructure at maintenance facilities (Russell Yard, Leslie Barns) given their prominence as incident locations.
- Consider enhanced pre-service vehicle inspection protocols to reduce "Late Leaving Garage" incidents.
For Service Planning:
- Use identified incident patterns (temporal peaks at 5-7 AM and 2-4 PM, route concentrations on 501/504) to inform schedule design and buffer time allocation.
- Consider operational dynamics that differ from traditional commuter patterns when planning service levels.
- Incorporate weekend vs. weekday operational differences identified in analysis into service planning approaches.
For Executive Leadership:
- Champion data-driven infrastructure investment decisions for identified high-incident routes (501, 504) and maintenance facilities (Russell Yard, Leslie Barns).
- Use analysis findings to justify capital allocation with evidence-based ROI projections for targeted infrastructure improvements.
- Track key performance indicators (incident frequency on target routes, mechanical incident rates, service reliability) to measure impact of data-informed interventions.
- Communicate evidence-based operational planning approach to stakeholders and public.
Model Limitations:
- Limited Predictive Accuracy: The overall Weighted F1-Score of 0.379 suggests that while the model provides insights, there's significant room for improvement in predictive accuracy, especially for minority classes and during rush hours.
- Struggles with 'Severe' Incidents (Rush Hour): The very low F1-score for 'Severe' incidents during rush hours (0.02) is a critical limitation, as these are high-impact events the model needs to predict effectively.
- Class Imbalance Impact: Despite efforts, class imbalance likely still affects the model's ability to generalize to less frequent incident types, as seen in the varied per-class performance.
Data Limitations:
- Historical Data Only: The model is trained on past incidents; unprecedented event types or shifts in operational patterns may not be predicted accurately.
- Missing External Factors: The current model does not include crucial external factors such as weather data, special events, or construction activity, which are known to influence transit delays.
- Limited Geographic Detail: While station and route information is available, more granular geographic data (e.g., specific intersections, track segments) could provide deeper insights.
- Temporal Scope: The 2014-2025 data, while extensive, may not fully capture very recent changes in operational procedures or system upgrades.
Operational Limitations:
- Real-Time Deployment: The current model is a proof-of-concept; operationalization requires integrating it into TTC's real-time systems for immediate predictive insights.
- Human Oversight Required: The model is a decision-support tool and should augment, not replace, the expertise and judgment of human operators and managers.
- Model Drift: Operational environments evolve; the model will require continuous monitoring, retraining, and updating to maintain its effectiveness over time.
With Additional Time/Resources:
-
Enhanced Feature Engineering:
- Integrate weather data (temperature, precipitation, extreme conditions) to capture environmental impacts.
- Include special events calendars (e.g., sports games, concerts, holidays) to account for demand surges.
- Incorporate construction and maintenance schedules that might pre-emptively cause delays or affect routes.
- Add real-time traffic data to better predict external factors affecting streetcar movement.
-
Advanced Modeling Techniques:
- Explore ensemble methods (e.g., stacking, boosting with more diverse base learners) to improve overall predictive power.
- Investigate deep learning approaches (e.g., LSTMs for time-series patterns) for potentially uncovering more complex temporal dependencies.
- Develop route-specific or location-specific models for highly localized incident prediction.
- Implement active learning strategies to continually refine the model with new, incoming data.
-
Expanded Scope:
- Expand the prediction to include incident severity and duration, not just type, to allow for more comprehensive operational planning.
- Integrate data from other transit modes (subway, buses) for a holistic view of the entire transit network.
- Develop prescriptive analytics that suggest specific mitigation strategies based on predicted incident types.
-
Operational Integration:
- Develop a user-friendly dashboard for operations staff to visualize predictions and key insights in real-time.
- Establish a robust feedback loop for operational staff to report on prediction accuracy and outcomes, informing model retraining.
- Implement a continuous monitoring system to detect model performance degradation or drift.
-
External Validation:
- Conduct A/B testing in collaboration with TTC: compare outcomes of proactive, model-guided management against reactive approaches.
- Validate the model's generalizability by testing it on incident data from other transit systems.
To ensure full reproducibility of this project, follow the steps below.
- Python Version: 3.9 or higher
- Operating System: Windows, macOS, or Linux
- Hardware: 4GB RAM minimum, 500MB disk space
- Software: Git, Python package manager (
pip)
1. Clone the Repository
git clone [repository-url]
cd ttc-incident-classification
2. Setup Virtual Environment & Install Dependencies
python -m venv venv
# Activate virtual environment
# On macOS/Linux:
source venv/bin/activate
# On Windows:
venv\Scripts\activate

pip install -r requirements.txt
3. Download Raw Data
Place the 12 TTC delay data files (e.g., ttc_delays_2014.xlsx, ttc_delays_2015.xlsx, ..., ttc_delays_2024.xlsx) into the data/raw/ directory within the cloned repository.
4. Run the Full Analysis Pipeline
This project's entire analysis pipeline (data consolidation, feature engineering, and model training/evaluation) can be executed. Choose one of the following options:
To run interactively and see all steps:
jupyter notebookThen, open and run the notebooks in the following order:
experiments/01_eda.ipynb(for EDA and Feature Engineering)experiments/02_modeling.ipynb(for Model Development & Evaluation)
Execute the main scripts sequentially:
# Run data consolidation and feature engineering
python src/data_consolidation.py

# Run model training and evaluation
python src/train_models.py
Expected Outputs:
After successfully running the pipeline, you should find:
- Consolidated and feature-engineered datasets in
data/processed/. - Trained models saved in the
models/folder. - Results and evaluation metrics in
reports/model_comparison.csv. - Evaluation visualizations (e.g., confusion matrices, feature importance plots) in
reports/figures/model_results/.
Running the full pipeline should produce:
- Final model accuracy: [X.XX]% (±0.02)
- F1-score (weighted): [X.XX] (±0.02)
- Total runtime: [X]-[Y] minutes (may vary based on hardware)
- Issue:
ModuleNotFoundError: No module named 'openpyxl'- Solution: Ensure all dependencies are installed by running
pip install -r requirements.txtwithin your activated virtual environment.
- Solution: Ensure all dependencies are installed by running
- Issue:
FileNotFoundError: data/raw/ttc_delays_2014.xlsx- Solution: Confirm that all 12 raw data files are correctly placed in the
data/raw/directory with their original filenames.
- Solution: Confirm that all 12 raw data files are correctly placed in the
- Issue: Out of memory error
- Solution: Close other applications or consider processing a smaller sample of the data if resource constraints persist.
- Issue: Model results differ slightly from reported
- Solution: Minor variations (<2%) are expected due to random initialization. For exact reproducibility, ensure any
random_stateparameters in the modeling code are consistently set.
- Solution: Minor variations (<2%) are expected due to random initialization. For exact reproducibility, ensure any
Contact For issues or questions about reproducibility:
- Open a GitHub issue in the repository
This project was completed by a 4-member data science team with the following roles: Member 1 - Data Acquisition & Cleaning Lead
- Consolidated 12 data files (2014-2024) into single dataset
- Standardized data formats and column names across years
- Implemented data quality checks and validation
- Created reproducible data pipeline Member 2 - Exploratory Data Analysis & Feature Engineering Lead
- Conducted comprehensive EDA identifying key patterns
- Created temporal, spatial, and operational visualizations
- Engineered time-based and categorical features
- Documented data insights for modeling Member 3 - Model Development & Optimization Lead
- Trained and evaluated multiple classification algorithms
- Performed hyperparameter tuning and cross-validation
- Handled class imbalance and model optimization
- Analyzed feature importance and model errors
- Selected and validated final production model Member 4 - Evaluation, Visualization & Reporting Lead (Me)
- Designed evaluation framework linking metrics to business value
- Created project infrastructure and documentation standards
- Synthesized team findings into comprehensive documentation
- Developed final presentation and business recommendations
- Ensured project reproducibility and quality standards
Version Control:
- Git/GitHub for code management
- Feature branch workflow with pull request reviews
- Each team member created and reviewed PRs
- Main branch protected - all changes reviewed before merge Project Management:
- GitHub Projects for task tracking
- Daily asynchronous updates in team communication channel
- Regular check-ins to address blockers
- Clear division of responsibilities with defined deliverables Documentation:
- Continuous documentation throughout development
- Each member maintained detailed notes in docs/ folder
- Code extensively commented for clarity
- README updated iteratively as project progressed Quality Assurance:
- Peer code reviews for all contributions
- Reproducibility tested at multiple checkpoints
- Regular team syncs to ensure alignment
- Clear communication of blockers and dependencies
Team memebers: - Member 1: Hossein Hooshmandi Safa - Data Acquisition & Cleaning Lead
- Member 2: Aman Kaushik - EDA & Feature Engineering Lead
- Member 3: Antonio Gao - Model Development & Optimization Lead
- Member 4: Janice Wilson - Evaluation & Reporting Lead
Video Presentations: Each team member recorded a 3-5 minute video discussing their individual contributions, challenges faced, learnings, and reflections on the project:
-
Aman kaushik: - (https://www.loom.com/share/853bf8dd692e4cb39e7170b4d11c9f3b)
-
Antonio Gao
Python 3.9+ Core Libraries: Data Processing: pandas, numpy Machine Learning: scikit-learn, Visualization: matplotlib, seaborn Data Loading: openpyxl (Excel files), xlrd (legacy Excel) Utilities: tqdm (progress bars)
Development Environment: Jupyter Notebook for exploratory analysis and modeling Git/GitHub for version control and collaboration Virtual environment for dependency management
File Structure:
ML_12/
├── data/
│ ├── raw/ # Original 12 data files
│ └── processed/ # Consolidated and processed data
├── models/ # modeling code & files
├── reports/
│ ├── charts/ # All visualizations
│ └── presentation/ # Showcase materials
├── src/ # py source code
├── docs/ # Documentation
├── requirements.txt # Python dependencies
└── README.md # This file
Toronto Transit Commission (TTC) Service Delay Data, 2014-2024 https://open.toronto.ca/dataset/ttc-streetcar-delay-data/
- scikit-learn documentation: https://scikit-learn.org/
We thank the Toronto Transit Commission for making this data publicly available, enabling data-driven analysis to improve public transit operations.