-
Notifications
You must be signed in to change notification settings - Fork 37
Threshold based metrics
Threshold-based metrics evaluate forecasts based on their ability to predict the exceedance or non-exceedance of a threshold. For example for a precipitation threshold of 20 mm, observations and forecasts can be categorized into hit, false alarm, miss, and correct rejection:

The thresholding creates a contingency table with values of a, b, c, and d. In general, better forecasts have more hits (a) and correct rejections (d) and fewer false alarms (b) and misses (d).
Numerous metrics exist that use the values of a, b, c, and d. Commonly used ones are the threat score (-m threat) the equitable threat score (-m ets), proportions correct (-m pc), symmetric extreme dependency score (-m seds), but there are many more supported in Verif. We will look at the threat score, which rewards hits and correct rejections and penalizes false alarms and misses. It is given by the equation a / (a + b + c).
verif ECMWF.nc MEPS.nc -m threat
This shows the threat score as the threshold is varied. Notice that the default x-axis is threshold, which is always the case for metrics that use the contingency table. The thresholds used in the figure are automatically selected, but can be specified by using the -r flag:
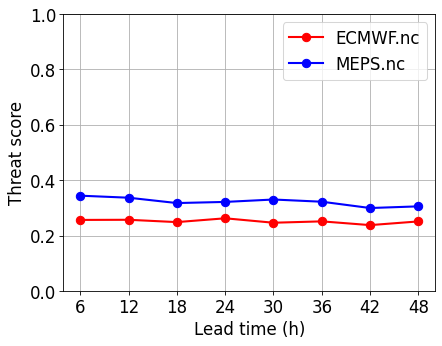
verif ECMWF.nc MEPS.nc -m threat -r 0:30If a different axis is specified, then verif shows the average threat score across all thresholds, for example:
verif ECMWF.nc MEPS.nc -m threat -r 0:30 -x leadtime
The same is true if the score is shown on a map. Note that if any of the thresholds yield undefined values (for example if if the denominator in the threat score calculation is 0), then the average will also be undefined.
For these scores the default is to define an event as exceeding a threshold (X > threshold). The -b option can be used to define how events are defined. Using -b below means that event occurs if the observation is below the threshold (effectively interchanging hit with correct rejection and false alarm with miss in the image above). Other options are -b below= (X <= threshold) and -b above= (X >= threshold). The default is -b above.
For metrics that have multiple thresholds, -b within forces Verif to consider the region between each consecutive pair as an event. Notice that the points on the graphs are now plotted in the middle of each bin, instead of at each threshold. -b =within means (lower <= X < upper) and -b within= and -b =within= are also defined.
verif ECMWF.nc MEPS.nc -m threat -r 0:5:30 -b within
Use -m within to measure the fraction of forecasts that have errors less than a threshold. At MET Norway, we often define a large forecast error for temperature to be +/-3°C.
Use -r to specify one or more thresholds. By default, the metric puts the threshold dimension on the x-axis. As expected, this shows that a higher fraction of forecasts are below the higher thresholds. Use -b to set the bin definitions. By default, this is below. The following:
verif ECMWF.nc MEPS.nc -m within -r 3 -x leadtimeshows the frequency of forecast errors that are below 3 m/s, for different leadtimes.
- Introduction
- Installation
- Basic usage
- Metrics and diagrams
- Visualization options
- Data manipulation options
- Datasets
- Other