This repository contains a series of notebooks with which we try to predict the leading factors that influence the number of sales that a store will recieve.
-
Bundas is a supermarket that has stores all over the country and has collected sales data for over 1000 products across its stores. You have been hired as a data scientist to build a predictive model to find out the sales of each product at a particular store.
-
They plan on using this model to understand the properties of products and stores that play a paramount role in increasing sales.
-
After analysing our dataset, we find that only 1.1% of the Item_IDs are repeated in the dataset which means that 98.9% of the items for sale in these stores are unique.
-
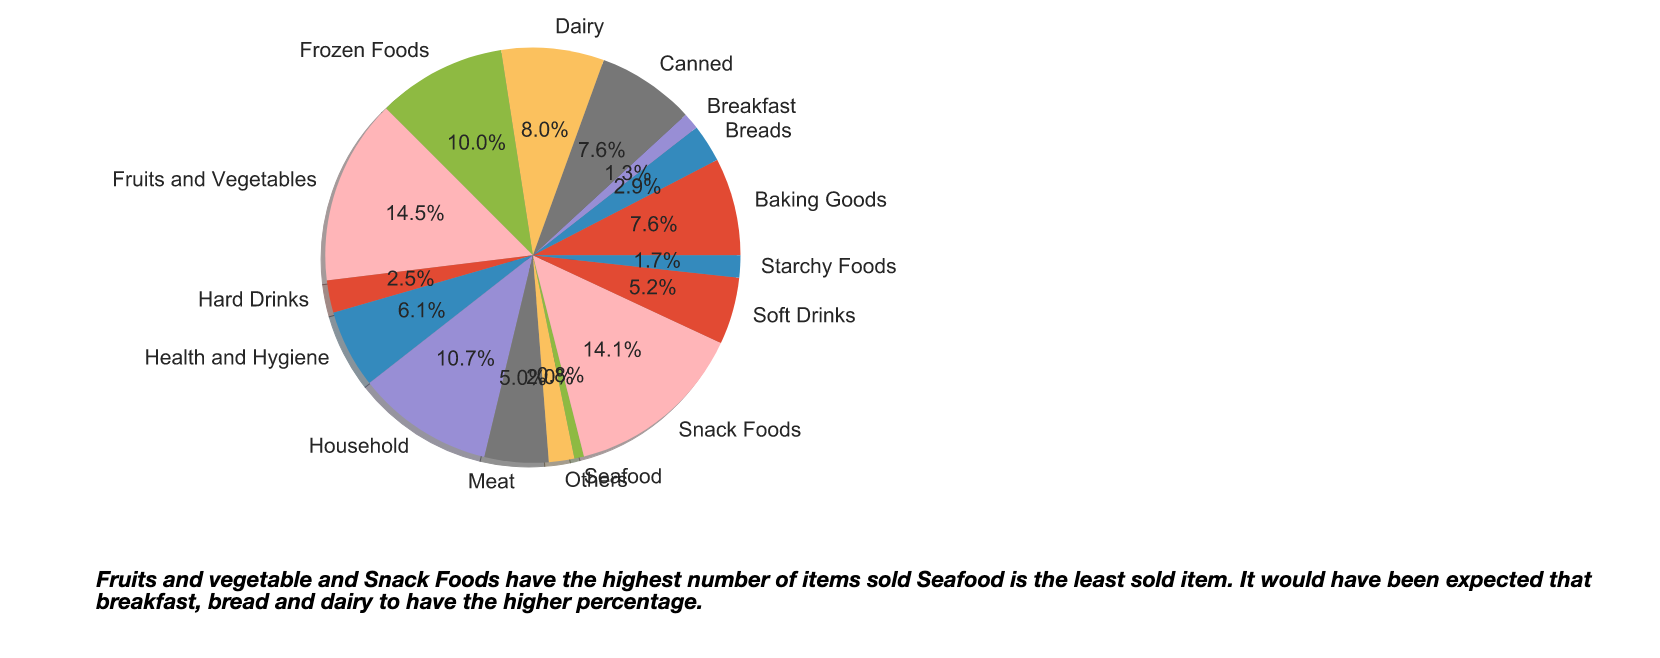
The most sold items were Fruits and Vegetables followed by Snack Foods while the least sold items were seafood. This may indicate that customers go to these stores for their groceries.
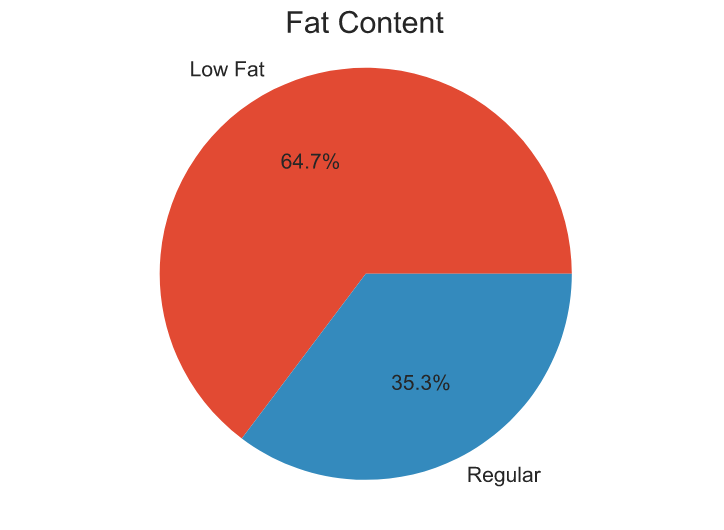
- Items with a lower fat content got more sales, hinting that customers preferred "healthier" products.
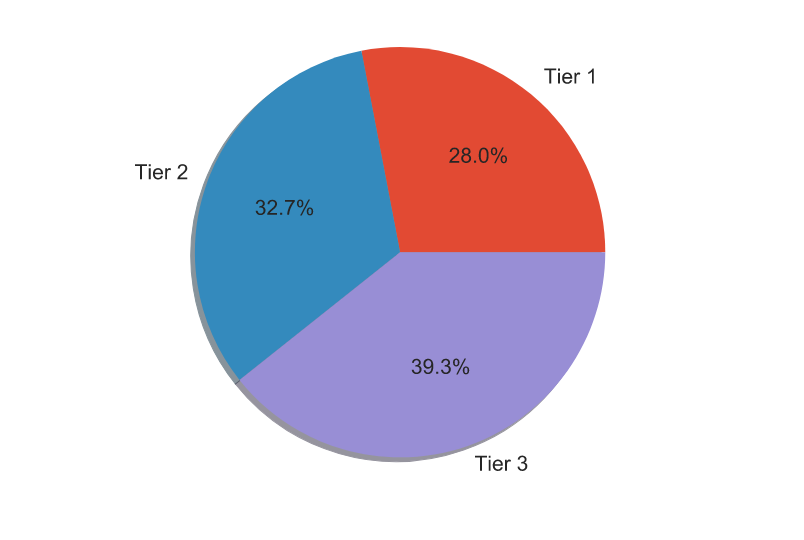
- The location of the store had a negligble influence on the amount of sales of items, indicating that the location (Middle or High Income locations) type of the stores may be the same.
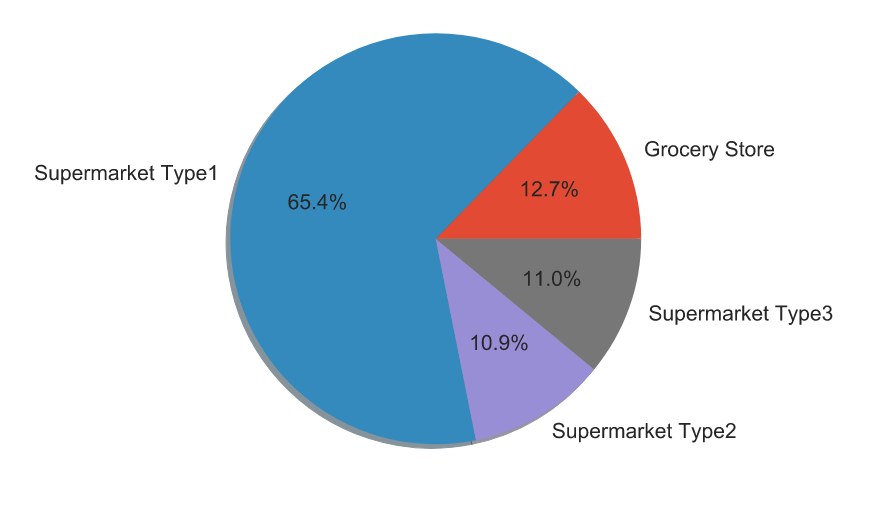
- In regards to the types of stores, supermarket type 1 has the highest number of sales with supermarket type 2 with the least amount of sales.
- There were no outliers in terms of price. The position of the median is closer to the upper quartile indication of skewness to the left, indicating that most of the items had a high maximum price.
-
After the missing data has either been filled or their rows removed from the "dealing with NAs.R" code in the R code folder, we encode the categorical values as our model only takes in numerical data as input.
-
The missing data (rows with missing features) make up less than 30% of our dataset and we therefore so it fit to remove it. This improved the performance of the model by about 16%.
-
Due to the low number of features, they were all retained in the final dataset used to build the model. Both the final test and train dataset were renamed to train_modified and test_modified.
- As this was a regression problem, we decided to start with a decision tree which was heavily overfitting. To counter this, we used a random forest which gave us the Test and OOB score below:
Train score: 0.6544021100663768
OOB score: 0.5832050004433629
- Unfortunately, the XG Boost Model did not perform well with a mean square error rate below
MSE: 1801.915228
