Node.js server and client for interacting with sensor data from Intel Galileo Gen 2 board
This is a hardware project and this code is designed to work with this specific hardware. Some parts can be reused, but I do not guarantee that they will work.
First, I will present the project idea, then the list of hardware components needed for it to work, and finally, I will describe the functionality of the software attached in this repository.
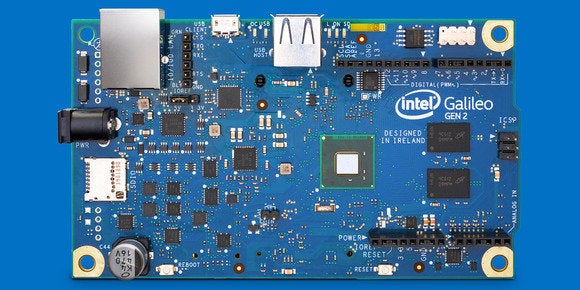
This project started from the idea of creating a DIY air quality monitor using different air sensors and the Intel Galileo Gen 2 board. The board is the hub of this project, being connected to the sensors and collecting data every 500ms. This data is then published using a Node.js webserver which can be accessed by any client within the same LAN with the board.
When the data exceeds normal thresholds, then an email is sent from the webserver (on the board) to a specified email address. Frequency of emails is set to be no more than one email every 5 minutes.

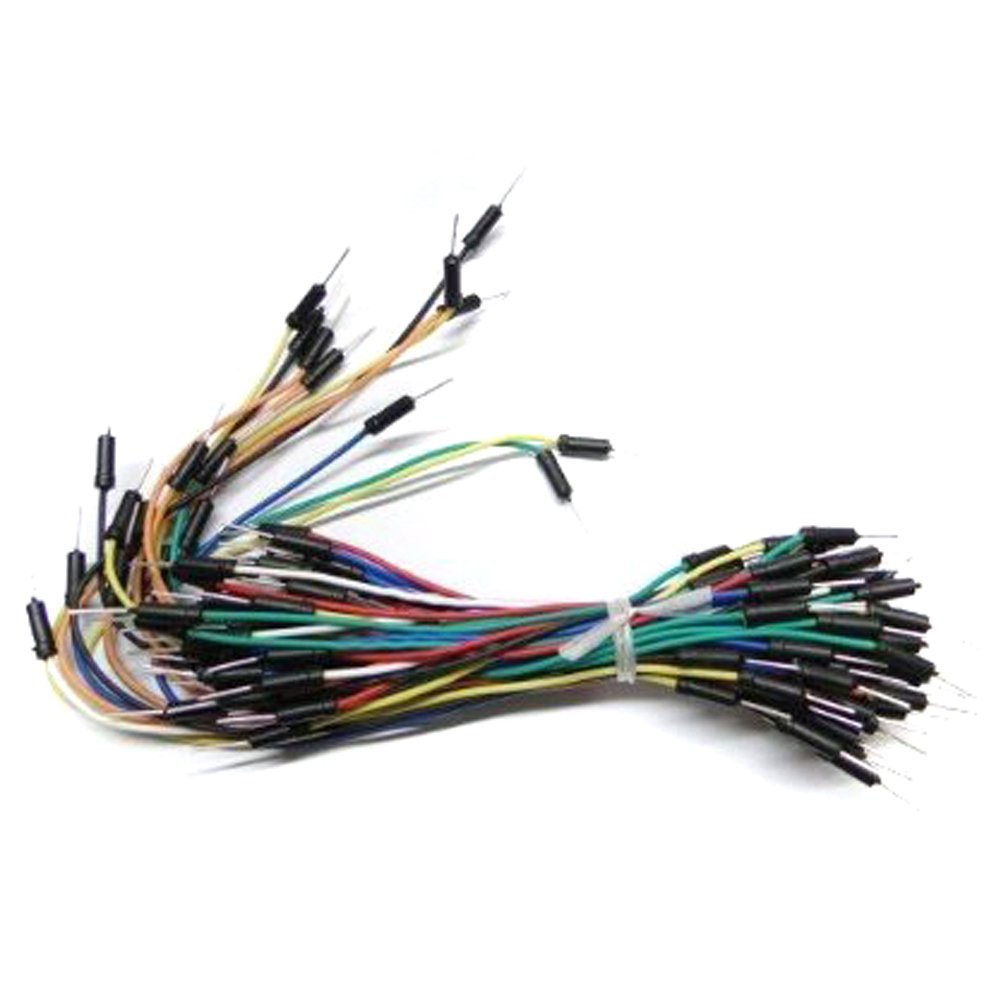
- A dozen Male-Male Jumper cables

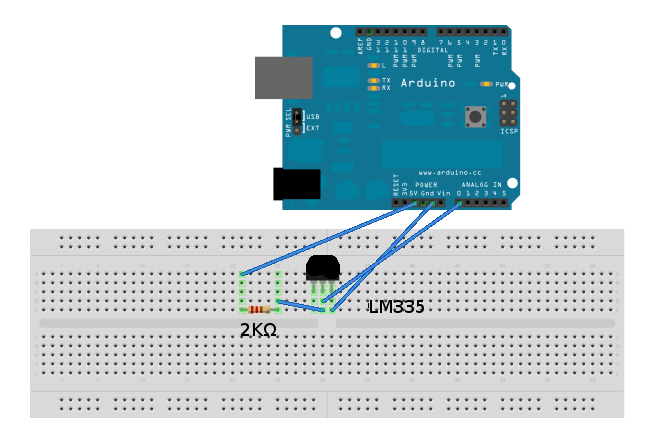
- 1 * Temperature sensor LM335Z

- 1 * 2kΩ resistor (I used a 2k2 one successfully as well) for the connection with the temperature sensor
- 1 * 4GB or more microSD card (Intel Galileo supports up to 32GB cards) for storing the linux image
- A microSD card reader, a phone, or anything that can be used to write the contents of the microSD card
- 1 * microUSB cable for connecting to the board
Connecting the temperature sensor is similar with that in the image below.
The gas sensor has 4 pins, thus being fairly simple to connect to any Arduino board.
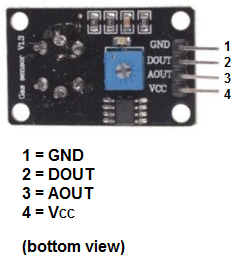
Similarly with the temperature sensor, the VCC pin of the MQ-4 sensor is connected to the 5V lane of the Arduino, and the GND pin to the GND lane of the Arduino.
The analog output pin number 3 (AOUT) of the gas sensor is connected to any of the analog inputs of the Arduino (e.g A0), while the digital output ping number 2 (DOUT) is connected to any of the digital inputs of the Arduino (e.g D0).

Basically this project consists of two modules:
- the client JavaScript (and HTML) application
- the NodeJS server
The Client application is responsible for communicating with the web server via messages through sockets and for displaying the graphs correctly on the page based on the data stream received from the server.
The NodeJS server is a web server installed on the Arduino board and is responsible for gathering the data from the sensors and streaming it to the web page on each update. It also sends emails to me when the gas sensor or temperature exceed a certain threshold. This is limited to maximum one email every 5 minutes in order to not flood my inbox.
This is how the webpage looks like after a couple seconds of reading data from the sensors.
