
Historical PyPI download stats for the Django Control Room packages.
This project uses pypi-tracker to collect stats about packages from pypi and builds a running history inside this repo. This project also provides an interface for visualizing stats available at stats.djangocontrolroom.com. Package data in this repo is collected and deployed on a daily basis.
This project is meant to hold stats for any panel/plugin in the DCR ecosystem. Pull requests for tracking existing third party panels are welcome (see below)
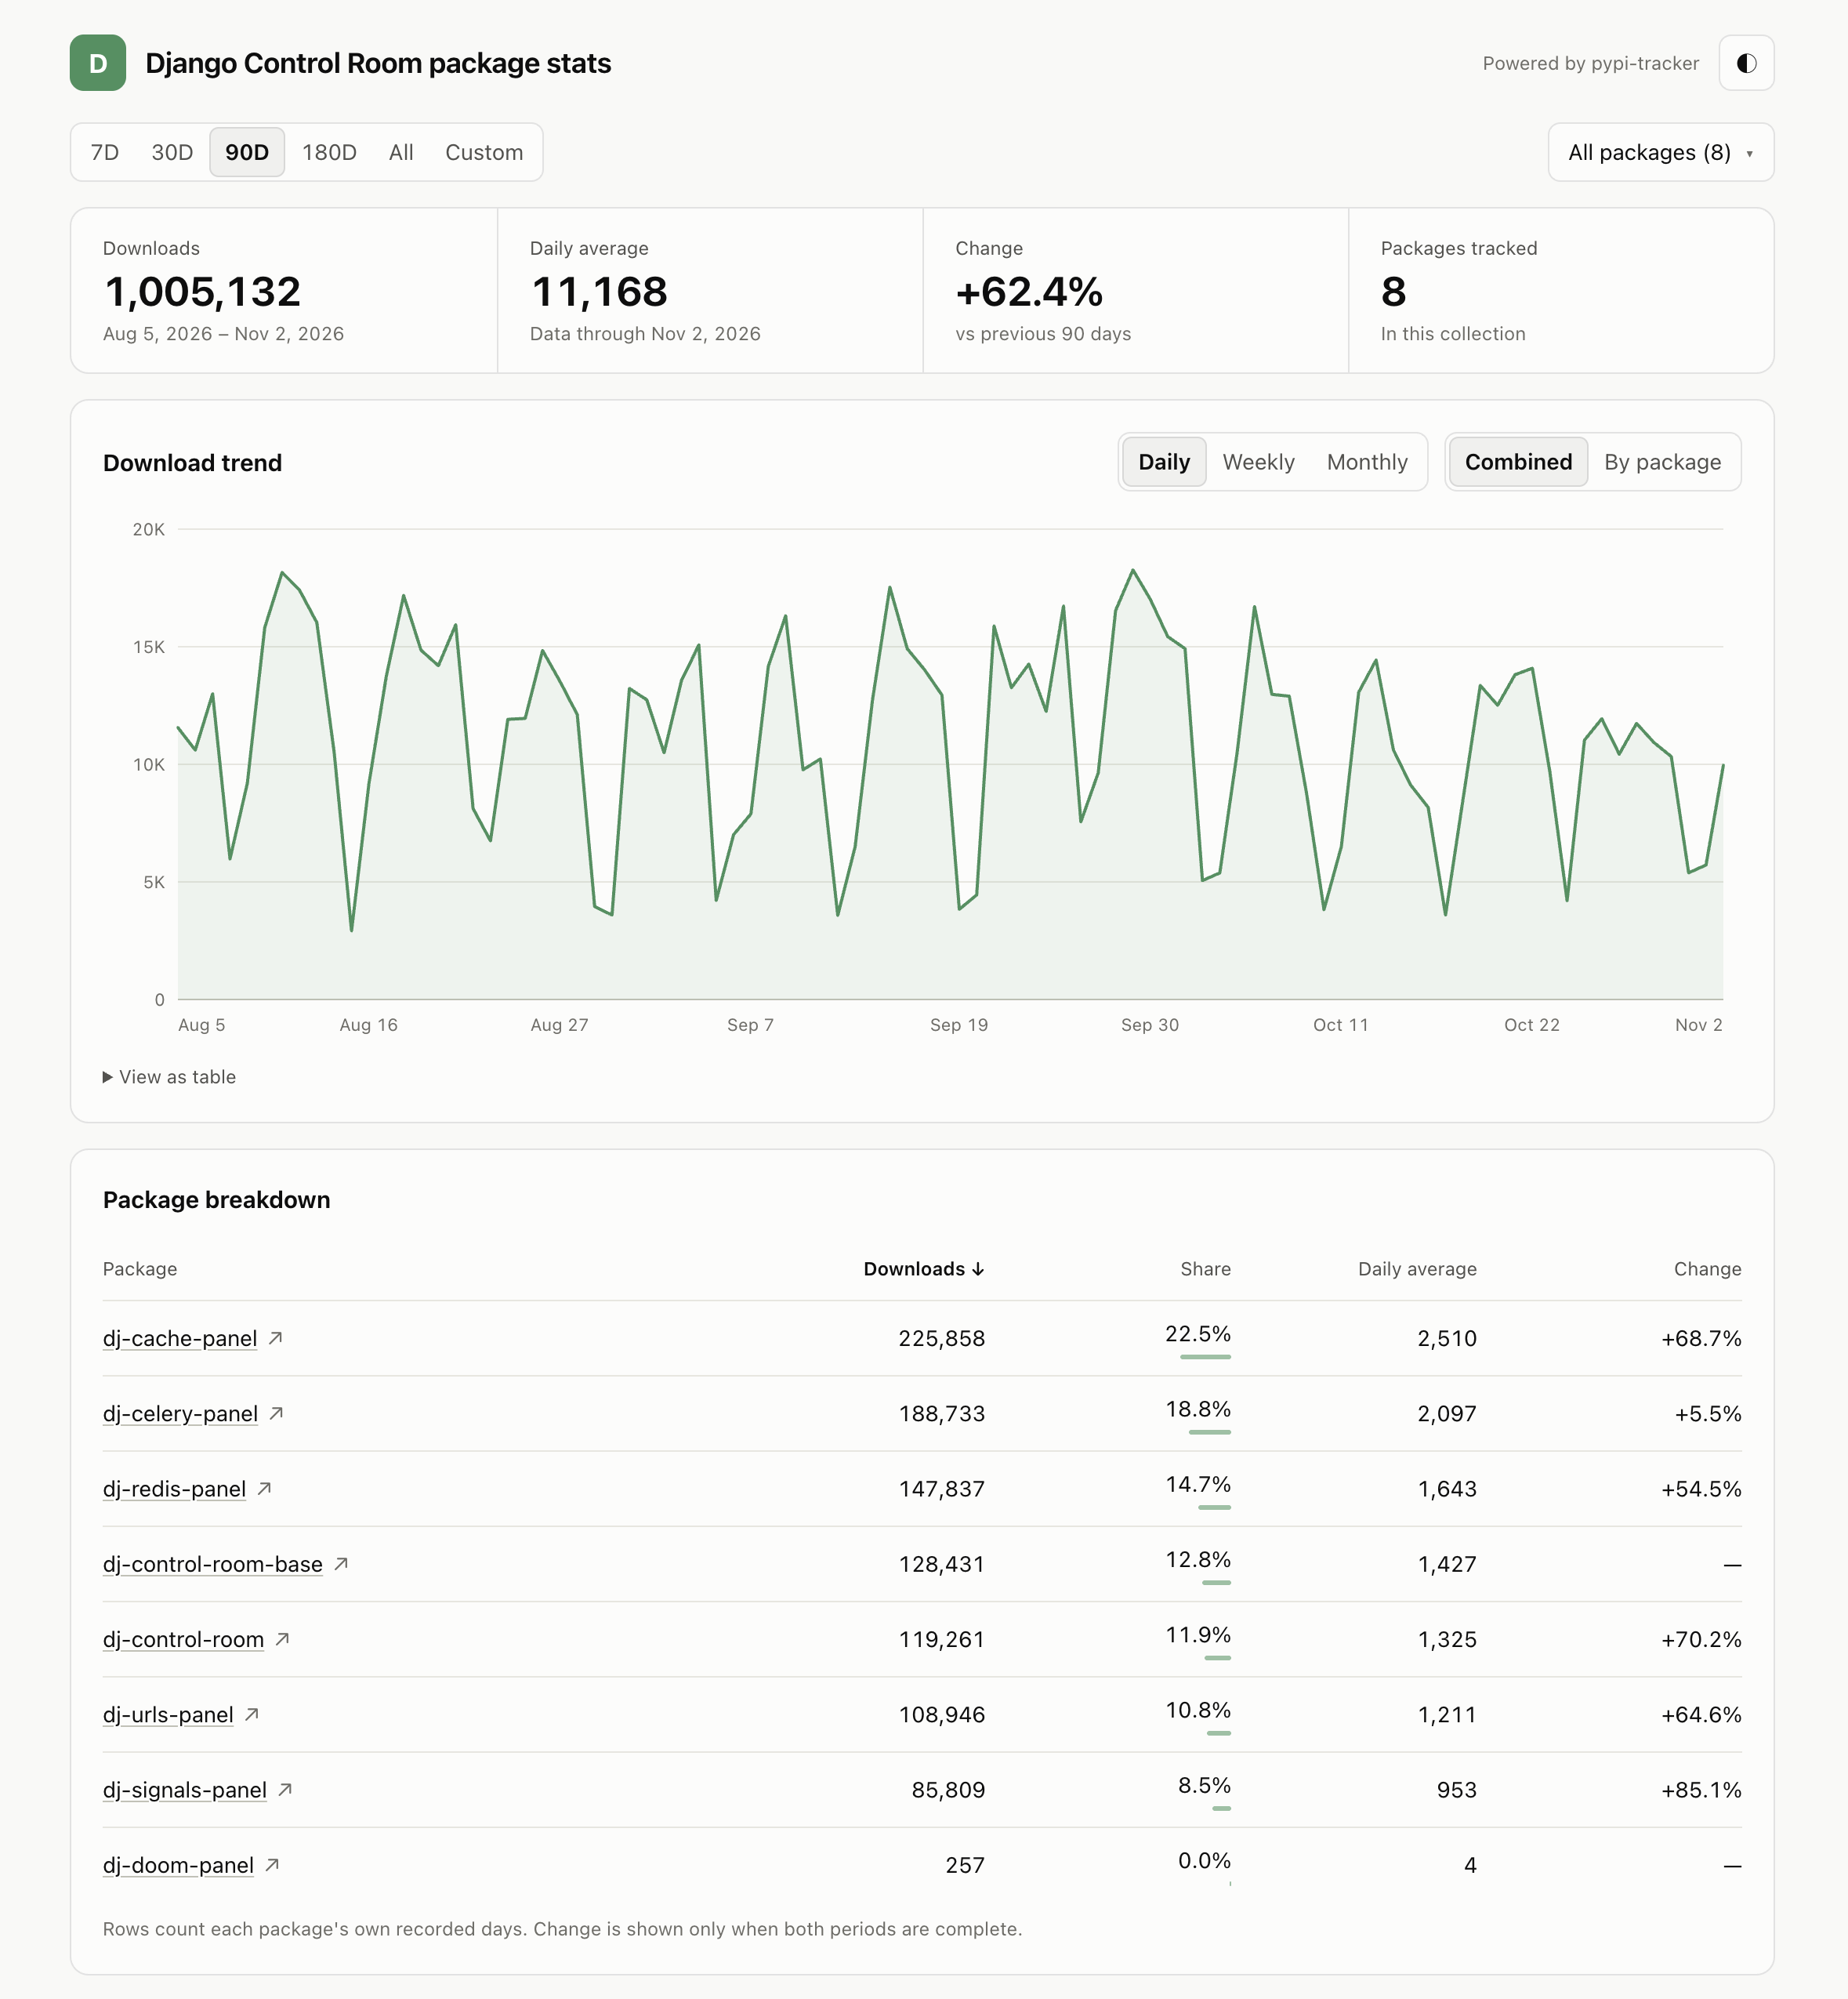
If you are a DCR panel author and want to track your package's historical stats, you can do it easily by
extending the packages list in pypi-tracker.toml. Doing so will start tracking your panel both in
aggregate stats as well as single package stats and will make your panel visible in the interface.
# pypi-tracker.toml

packages = [
    "dj-control-room",
    "dj-control-room-base",
    "dj-redis-panel",
    "dj-cache-panel",
    "dj-celery-panel",
    "dj-urls-panel",
    "dj-signals-panel",
    "dj-doom-panel",
    ...
    "<your package goes here>",
]
Through pypi-tracker,this project exposes data through downloadable files in json format. These form an API for reporting data that can be consumed.
Existing reports are available in aggregate forms
stats.djangocontrolroom.com/packages/dj-celery-panel/summary.json
Or as package specific forms:
stats.djangocontrolroom.com/packages/dj-celery-panel/summary.json
Reports include:
| File | Contents |
|---|---|
summary.json |
First and last recorded dates, total recorded downloads and any coverage gaps. |
last-7-days.json, last-30-days.json, last-90-days.json, last-180-days.json |
Rolling windows: a total plus one observation per day, ending at the latest recorded date. One file per entry in rolling_days. |
weekly.json |
Totals for every ISO week, Monday through Sunday. |
monthly.json |
Totals for every calendar month. |
yearly.json |
Totals for every calendar year. |
daily/<year>.json |
Every recorded day in that year, such as daily/2026.json. |