Diagnosting 'Debug adapter process has terminated unexpectedly'
If Visual Studio code displays "Debug adapter process has terminated unexpectedly", and the debug console doesn't have information about why, this generally means that the debugger process (vsdbg-ui) crashed. Here is some information you can provide us to diagnose what went wrong.
On all OSs, it can be useful to have logging enabled, and to provide the last bit of the event log.
- Open 'Console' from the Application->Utilities
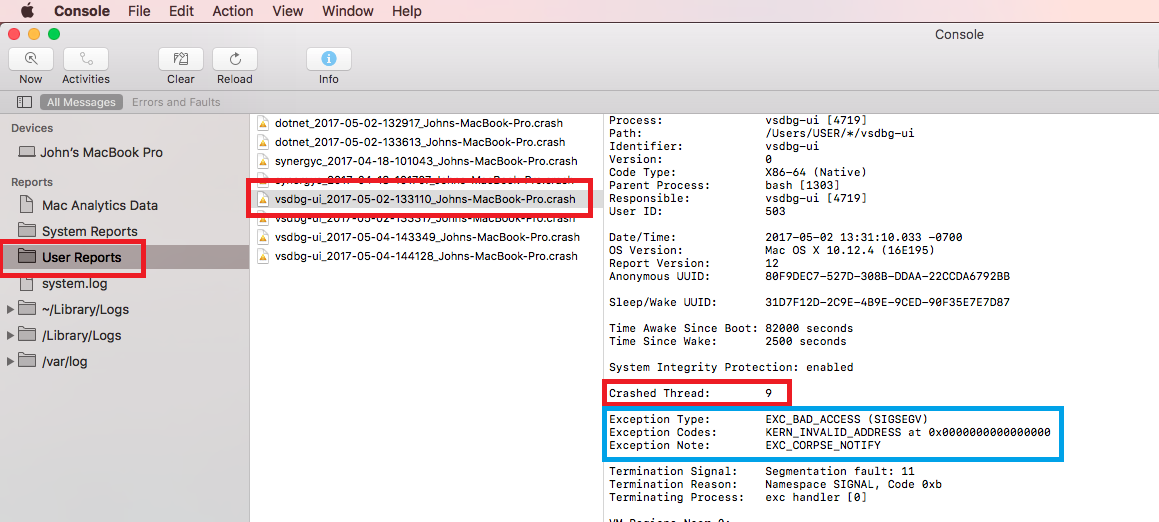
- Go to 'User Reports', and find the vsdbg-ui crash (see screen shot below).
- Copy paste the 'Exception Type', 'Exception Codes' and 'Exception Note' section into the GitHub issue.
- Also look at the 'Crashed Thread', then find the call stack for that thread, and send that too (see example below).
Thread 9 Crashed:
0   libsystem_c.dylib             	0x00007fffbbc43b52 strlen + 18
1   libc++.1.dylib                	0x00007fffba7e0b27 std::__1::basic_string<char, std::__1::char_traits<char>, std::__1::allocator<char> >::assign(char const*) + 21
2   libvsdbg.dylib                	0x0000000103fab41f VsCode::LaunchOptions::Deserialize(rapidjson::GenericValue<rapidjson::UTF8<char>, rapidjson::MemoryPoolAllocator<rapidjson::CrtAllocator> > const&, VsCode::LaunchOptions&, std::__1::basic_string<char, std::__1::char_traits<char>, std::__1::allocator<char> >&) + 1999
3   libvsdbg.dylib                	0x0000000103f70fe0 VsCode::CVsCodeProtocol::HandleLaunchRequest(rapidjson::GenericDocument<rapidjson::UTF8<char>, rapidjson::MemoryPoolAllocator<rapidjson::CrtAllocator>, rapidjson::CrtAllocator> const&, std::__1::basic_string<char, std::__1::char_traits<char>, std::__1::allocator<char> >&, unsigned int&, bool&) + 288
4   libvsdbg.dylib                	0x0000000103f6e6a0 VsCode::CVsCodeProtocol::HandleRequest(char const*) + 1648
5   libvsdbg.dylib                	0x0000000103f62e7c std::__1::__function::__func<VsCode::CommandQueue::SyncCommand(std::__1::function<int ()>)::$_1, std::__1::allocator<VsCode::CommandQueue::SyncCommand(std::__1::function<int ()>)::$_1>, int ()>::operator()() + 28
6   libvsdbg.dylib                	0x0000000103f629f8 VsCode::CommandQueue::CommandLoop() + 360
7   libvsdbg.dylib                	0x0000000103f6cfc7 CVsCodeMainLoop::Run() + 103
8   libvsdbg.dylib                	0x0000000103f10b41 RunMainLoop + 17
9   ???                           	0x000000011038d5a3 0 + 4567127459
10  ???                           	0x000000011038128e 0 + 4567077518
11  ???                           	0x000000010fee99c6 0 + 4562262470
12  ???                           	0x000000010fe99e71 0 + 4561935985
13  ???                           	0x000000010fee9fc7 0 + 4562264007
14  ???                           	0x000000010fee9ce8 0 + 4562263272
15  ???                           	0x000000010feffd25 0 + 4562353445
16  libcoreclr.dylib              	0x00000001017c99a1 CallDescrWorkerInternal + 124
17  libcoreclr.dylib              	0x00000001016b5b43 MethodDescCallSite::CallTargetWorker(unsigned long const*, unsigned long*, int) + 707
18  libcoreclr.dylib              	0x00000001016d1025 QueueUserWorkItemManagedCallback(void*) + 165
19  libcoreclr.dylib              	0x000000010167515a ManagedThreadBase_DispatchOuter(ManagedThreadCallState*) + 378
20  libcoreclr.dylib              	0x0000000101675803 ManagedThreadBase::ThreadPool(ADID, void (*)(void*), void*) + 51
21  libcoreclr.dylib              	0x0000000101669d4c ManagedPerAppDomainTPCount::DispatchWorkItem(bool*, bool*) + 268
22  libcoreclr.dylib              	0x0000000101694b00 ThreadpoolMgr::WorkerThreadStart(void*) + 992
23  libcoreclr.dylib              	0x00000001014ede48 CorUnix::CPalThread::ThreadEntry(void*) + 328
24  libsystem_pthread.dylib       	0x00007fffbbe269af _pthread_body + 180
25  libsystem_pthread.dylib       	0x00007fffbbe268fb _pthread_start + 286
26  libsystem_pthread.dylib       	0x00007fffbbe26101 thread_start + 13
- Open a powershell prompt
- Run
Get-EventLog -LogName Application -Source 'Windows Error Reporting' -after (get-date).AddDays(-1) | Where Message –match 'P1:\s+(vsdbg-ui.exe|vsdbg.exe)' | Format-List | clip - Paste the results into the bug
- Open Event Viewer
- Go to Windows Logs->Application
- Find an event with a Source of 'Application Error' or 'Windows Error Reporting' for the crash
- Copy/paste the event details. Something like the following.
Faulting application name: vsdbg-ui.exe, version: 1.1.0.1179, time stamp: 0x58224b03
Faulting module name: vsdbg.DLL, version: 15.1.10517.0, time stamp: 0x591cc77d
Exception code: 0xc0000005
Fault offset: 0x00000000002e3d3a
Faulting process id: 0x2dd8
Faulting application start time: 0x01d2cf58f1e7031e
Faulting application path: C:\Users\greggm\.vscode\extensions\ms-dotnettools.csharp-1.21.18\.debugger\vsdbg-ui.exe
Faulting module path: C:\Users\greggm\.vscode\extensions\ms-dotnettools.csharp-1.21.18\.debugger\vsdbg.DLL
Report Id: 694807aa-44e0-42d3-8129-437f457a5efd
Faulting package full name:
Faulting package-relative application ID:
TBD