Troubleshoot Breakpoints
When debugging, a breakpoint has two possible visual states: a solid red circle and a hollow grey circle. If the debugger is able to successfully set a breakpoint in the target process, it will stay a solid red circle. If the breakpoint is a hollow circle a warning has occurred when trying to set the breakpoint. To see the warning, hover over the breakpoint in the debug view:
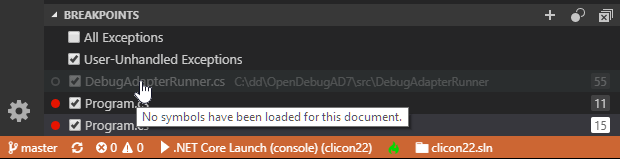
The following two sections describe prominent warnings and how to fix them.
NOTE: If you have an app that exits immediately so that you cannot read the message in time, you can add a call to System.Threading.Thread.Sleep(-1); in your Main method.
Look at the 'Debug Console' and check if there is a line indicating that your module loaded (example: Loaded 'C:\MyProject\bin\Debug\netcoreapp2.2\MyProject.dll'. Symbols loaded.)
If the line exists, did symbols load?
- If symbols are not loaded:
- Did the debugger provide additional information in the log lines around this?
- If the dll is being loaded from a different directory from where it was originally built, you may need to add an additional directory through the symbol search path -- in your launch.json file, add a "symbolsOptions/searchPaths" section (documentation).
- If symbols are loaded, the PDB does not contain information about your source files. These are a few possible causes:
- If your source files were recently added, confirm that an up-to-date version of the module is being loaded.
- The PDB file is partially corrupted. Delete the file and perform a clean build of the module to try to resolve the issue.
- If your module is not loaded:
- Confirm that your code is actually running. For example, add a new logging line.
- Confirm that the debugger is attached to your process. You can do this by adding a call to
System.Diagnostics.Debugger.IsAttachedand logging the result. If you are attaching, you might also want to call something likeConsole.WriteLine("MyProgram is running in process {0}.", Environment.ProcessId)to list the process id and compare that to the process you are trying to debug.
If a source file has changed and the source no longer matches the code you are debugging, the debugger will not set breakpoints in the code by default. Normally, this problem happens when a source file is changed, but the source code wasn’t rebuilt. To fix this issue, rebuild the project. If the build system thinks the project is already up-to-date even though it isn’t, you can force the project system to rebuild either by saving the source file again or by cleaning the project’s build output before building.
In rare scenarios, you may want to debug without having matching source code. Debugging without matching source code can lead to a confusing debugging experience, so make sure that this is how you want to proceed. To disable these safety checks, edit your launch.json file, and add "requireExactSource": false.
This section provides information to troubleshoot issues when the debugger isn’t displaying any warnings – the breakpoint is a solid red circle while actively debugging, yet the breakpoint isn’t being hit.
Here are a few things to check:
- If your code runs in more than one process or more than one computer, make sure that you are debugging the right process or computer.
- Confirm that your code is running. To test that your code is running, add a call to
System.Diagnostics.Debugger.Breakto the line of code where you are trying to set the breakpoint and then rebuild your project. - If you are debugging optimized code, make sure the function where your breakpoint is set isn’t being inlined into another function. The
Debugger.Breaktest described in the previous check can work to test this issue as well.
If you deleted a breakpoint while debugging, you may hit the breakpoint again the next time you start debugging. To stop hitting this breakpoint, make sure all the instances of the breakpoint are removed from the Breakpoints window.