A Python toolkit for mapping and analyzing Marine Heatwaves (MHWs) using gridded Sea Surface Temperature (SST) datasets and XArray.This repository provides tools to compute ocean warm intensity continuously or categorized during a MHW and map it according to the methodology defined by Hobday et al. (2016).
| Folder | Description |
|---|---|
| mhwxamap | Modules with auxiliary and MHWs intensity computing |
| nbks_examples | Notebooks with example usage of the tool for a warming event |
| data_example | Example OISST data for running example notebooks |
According to Hobday et al. (2016), a MHW is defined as a “prolonged discrete anomalously warm water event that can be described by its duration, intensity, rate of evolution, and spatial extent”. These events are relevant because of the variety of impacts that have been associated with, including shifts in species ranges and local extinctions, and economic impacts on aquaculture and seafood industries through declines in important fishery species.
To use this tool effectively, follow these steps:
Download gridded SST data from a reliable source with a daily temporal resolution. One of the most used products for this case is the OISST (Huang et al., 2021). Data con be downloaded from here
Ensure the dataset:
- Has, at least, 30 years of daily data
- Is in NetCDF or any other XArray supported format
- Uses consistent spatial coordinates (lat/lon)
Detect MHW events for your study region using any of the available implementations of the Hobday et al. (2016) methodology. You can try with Python implementation created by Eric C. J. Oliver or build your own one.
This step should provide:
- Event start and end dates
- Event peak date
Note: According to the repo structure, you must add the module path to load it later
# Clone GitHub repo
git clone https://github.com/francobarrionuevoenv21/MHW_xarray_mapping.git

# Add the module path to use it as a Python package
import sys
sys.path.append("/content/MHW_xarray_mapping")
Note: Find the step-by-step in the folder nbks_example
from mhwxamap.mhwMap import mapIntensityCont as micn
from mhwxamap.mhwMap import mapIntensityCat as micg
PATH_SST = "..." # Define SST data path
MHW_DATE = "2017-03-1" # MHW peak date or any other date of interest
Single-date continuous and categorized intensity map

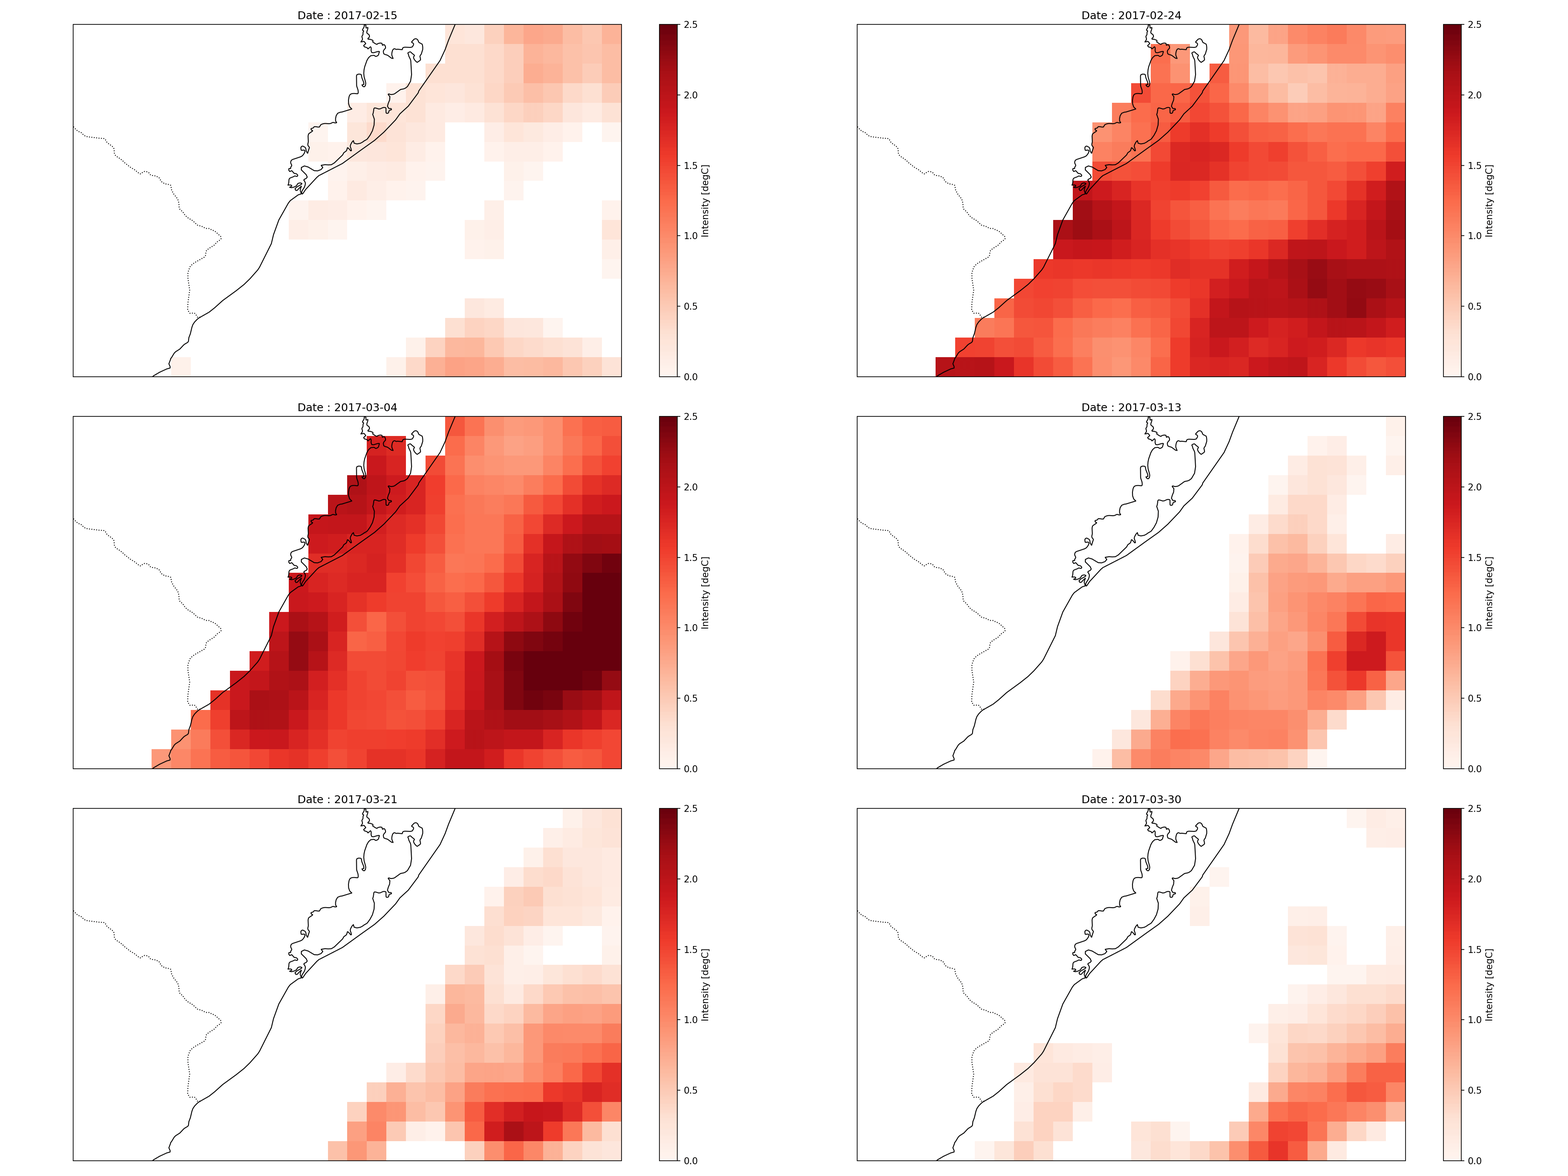
Multi-date continuous intensity animation
This project is licensed under the MIT License.
Hobday, A. J. et al. (2016). A hierarchical approach to defining marine heatwaves. Progress in Oceanography, 141, 227–238. https://doi.org/10.1016/j.pocean.2015.12.014
Hobday, A.J. et al. (2018). Categorizing and naming marine heatwaves. Oceanography 31(2):162–173, https://doi.org/10.5670/oceanog.2018.205
Huang, B. et al. (2021). Improvements of the Daily Optimum Interpolation Sea Surface Temperature (DOISST) Version 2.1. Journal of Climate, 34(8), 2923-2939. https://doi.org/10.1175/JCLI-D-20-0166.1