Hochschule der Medien Stuttgart
Studiengang Computer Science and Media
WS 2013/2014
Team:
- Friedolin Förder [email protected]
- Leon Schröder [email protected]
Professor:
Prof. Dr. Walter Kriha
Link to the reference project: https://github.com/schreon/morepeople-server
- Unit Tests
- Automated Tests
- Coverage
- Static Code Analysis
- SonarQube
- Integration into Git
- Profiling
- Excursion: Test-Driven Development of Android Applications
Unit tests can be easily written using the unittest module of the Python standard library together with the Flask Test Client. Normally, the database / persistence layer should be mocked and only the interfaces of the components under test should be accessed from within the tests. But Flask server applications are very easy to test by directly accessing its routes using the test client while running the application in debug mode.
As a reference, have a look at our morepeople server which is based on these technologies.
In the following, we show how we incorporate a real mongodb instance in our morepeople server tests, making them actually integration tests:
class FlaskAppTestCase(unittest.TestCase):

    @classmethod
    def setUpClass(self):
        os.environ['MORE_PEOPLE_DB'] = 'localhost'
        os.environ['MORE_PEOPLE_DB_NAME'] = 'morepeople_testing'
        os.environ['MORE_PEOPLE_LOG'] = 'morepeople_test.log'
        import server
        self.server = server
        # chooses testing config, i.e. in-memory db:
        self.app = self.server.app.test_client()

    def setUp(self):
        self.server.users.remove({})
        self.server.queue.remove({})
        self.server.tags.remove({})
        self.server.lobbies.remove({})
        self.server.matches.remove({})
        self.server.evaluations.remove({})

    def test_server_being_up(self):
        """ Test if self.server.is up. """
        response = self.app.get('/')
        self.assertEqual(response.status_code, 200)
In the code above, we first set up the python module in the setUpClass method. Before the server module is imported, environment variables are set, so the application will access a defined mongodb instance. This is important when running the tests in an continuous integration environment: in no case should the tests access the production database.
The setUp method is called before each test case and it clears all entries out of the mongodb collections.
The last method named test_server_being_up is the first very simple test case. It uses the test client to simulate a HTTP request to the root route / and checks if the response's status code is set to 200.
The following test is a bit more sophisticated:
    def test_enqueue_user(self):
        """ test_enqueue_user """
        data = {
            'USER_ID' : 'test_1234567',
            'USER_NAME' : 'test__user',
            'MATCH_TAG' : "beer",
            'LOC': {'lng' : 40, 'lat' : 9 }
            }

        headers = [('Content-Type', 'application/json')]


        # should not be there initially
        self.assertTrue(self.server.queue.find_one(data) is None)

        response = self.app.post('/queue', headers, data=json.dumps(data))

        # should be there now
        self.assertTrue(self.server.queue.find_one({'USER_ID' : data['USER_ID']}) is not None)
What happens here is that a request containing json data is sent to the /queue route. Instead of inspecting the response, we directly access the server application and assert that a new data entry has been created in the mongodb instance. This kind of test is very powerful, because we only need to access the interface of the Flask application (basically the REST routes) and can assert the correct functionality of the application by directly accessing the persistence layer.
The tests can be run by using the nose module. Nose will scan all subdirectories of the current working directory for python files. Classes which inherit from the unittest.TestCase are then again scanned for methods beginning with "test" - for example test_enqueue_user. Nose then runs these tests and collects the results.
Nose can be called by simply typing nosetests. The test results can be saved in the XUnit format by adding the command line argument --with-xunit.
Nose ships with the coverage package and incorporates it additional command line arguments:
nosetests --with-xunit --with-coverage --cover-package=server --cover-html --cover-html-dir=htmlcov tests
The line above runs all tests within the tests folder and generates Xunit results. Additionally, the coverage plugin is run by specifying the command --with-coverage. By also specifiying the package name which should be tests (in our case server ), 3rd party libraries are not included in the test coverage analysis. The last two arguments --cover-html and --cover-html-dir=htmlcov simply state that the coverage results should be created as HTML, into a directory called htmlcov.
We created some bash scripts which are automatically run on our development server whenever we push any code changes to our git repository. The resulting code coverage reports can be viewed following this link.
Static code analysis can be done using the pylint library. It scans the source files without actually running them and generates reports indicating several metrics. The following command generates an HTML report for the server module and saves them in a file named index.html:
pylint --output-format=html server >> index.htmlAs with the automated unit tests and coverage, we generate the pylint reports automatically on every git push. The resulting reports belonging to our morepeople project can be viewed here: http://109.230.231.200/werkbank/lint/
All the techniques mentioned above are capable of generating reports in all usual data exchange formats (as well as HTML which can be viewed in the browser). Tools like SonarQube aggregate such results and display them in a dashboard, providing an all-in-one overview. For example, this view nicely displays the results of pylint which were generated based on our morepeople server: http://109.230.231.200:9000/drilldown/issues/morepeople.server?severity=MAJOR
To automatically collect the test, coverage and linter results and put them into the SonarQube database, the so called sonar-runner, is necessary. For each programming language, a separate plugin is needed. In this case, we use the Python Plugin.
The execution of automated unit tests, static code analysis and the transfer of the results to the SonarQube database can scheduled after every change to the code base. We developed a so called post-receive hook which starts another linux shellscript running in the background. The scripts are run whenever a developer pushes code changes to our git respository. The following script must be named post-receive and must be placed into the hooks folder of the git repository on the server:
#!/bin/sh
echo "Testing and deploying app."
exec /path/to/repository/hooks/updaterepo.sh >&- 2>&- &
As a convention, the git process running on the server will execute this script after code changes have been applied to the repository. The script starts another script named updaterepo.sh so that it runs in a separate process in the background. Here are the contents of updaterepo.sh:
#!/bin/sh
rm -rf /path/to/test-folder/
git clone /path/to/repository /path/to/test-folder/application-name
cd /path/to/test-folder/application-name
/path/to/virtualenv/bin/coverage erase
/path/to/virtualenv/bin/nosetests -v --with-xunit --with-coverage --cover-erase --cover-package=server tests --cover-branches --cover-html --cover-html-dir=htmlcov --cover-xml --cover-xml-file=coverage.xml
rm -rf /path/to/reports/htmlcov
cp -R /path/to/test-folder/application-name/htmlcov /path/to/reports/htmlcov
cd /path/to/test-folder/application-name
/path/to/virtualenv/pylint --output-format=html server >> /path/to/reports/lint/index.htmlWe have two profiling strategies:
- creating profiling snapshots at every push to the repository
- in detail profiling with tools like the Flask Debug-toolbar
###Creating profiling snapshots
At every push to the repository the tests will be started in debug mode with profiling enabled. So for every request there is the following profiling information:
- a callstack as textfile, created with the module cProfile and the Stats class
- the profile binary file, created with ProfilerMiddleware from the werkzeug module
- a dot image, created with Gprof2Dot
- a kcachegrind file for later in detail profiling inspections
So the changes and the corresponding effects to the code can easily tracked by looking at performance profile files. You can go the server and compare two versions in the repository. The folder structure is like this:
profiling
    2014-02-17_18:20:37
        GET.root.000738ms
            callstack.txt
            dot.png
            profile.kgrind
            profile.prof
        GET.user.002123ms
            callstack.txt
            dot.png
            profile.kgrind
            profile.prof
    2014-02-19_11:14:20
        GET.root.001099ms
            callstack.txt
            dot.png
            profile.kgrind
            profile.prof
        GET.user.003041ms
            callstack.txt
            dot.png
            profile.kgrind
            profile.prof
The script which processes the profiling and creates the files is the profile.py script.
An example of a created dot.png file:
And the corresponding (relevant) content of the callstack file:
Wed Feb 19 11:14:21 2014    profiling/2014-02-19_11:14:20/GET.root.001099ms/profile.prof

         100330 function calls in 1.099 seconds

   Ordered by: internal time, function name

   ncalls  tottime  percall  cumtime  percall filename:lineno(function)
   100000    1.083    0.000    1.083    0.000 /home/friedolin/git/python-profiling/app.py:12(calculate)
        1    0.015    0.015    1.099    1.099 /home/friedolin/git/python-profiling/app.py:17(hello_world)
Here in this example you can see that the calculate-function takes almost all of the execution time.
###In detail profiling
Creating profiling snapshots is a good thing to see performance changes in your codebase, but this is not enough to fix serious performance problems. Therefore you should profile your code manually. We've take a look at the following tools for python:
- See profiling information for every request with Flask Debug-toolbar
- Graphical view of the call map and call graph with kcachegrind
- Memory profiling with Line Profiler
####Live profiling with the Flask Debug-toolbar
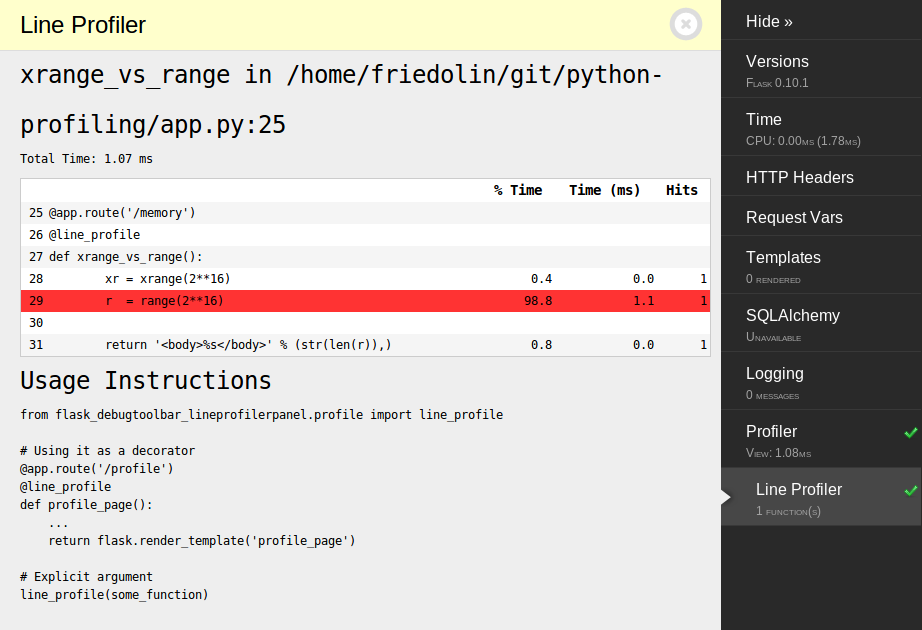
For the flask framework there is a very useful tool called Debug-toolbar. With this you can not only inspect the request variables, templates, configuration variables, logging but also the callstack of the creation of the visited page and a line profiler (LineProfilerPanel-Plugin) which highlights critical lines, as you can see in this minimal example:
This makes it very easy and comfortable to discover the internals of the application and find possible bugs and performance bottlenecks.How you can use a line profiler for profiling memory usage is described in the chapter "Memory profiling".
####Using kcachegrind to visualize the calltree
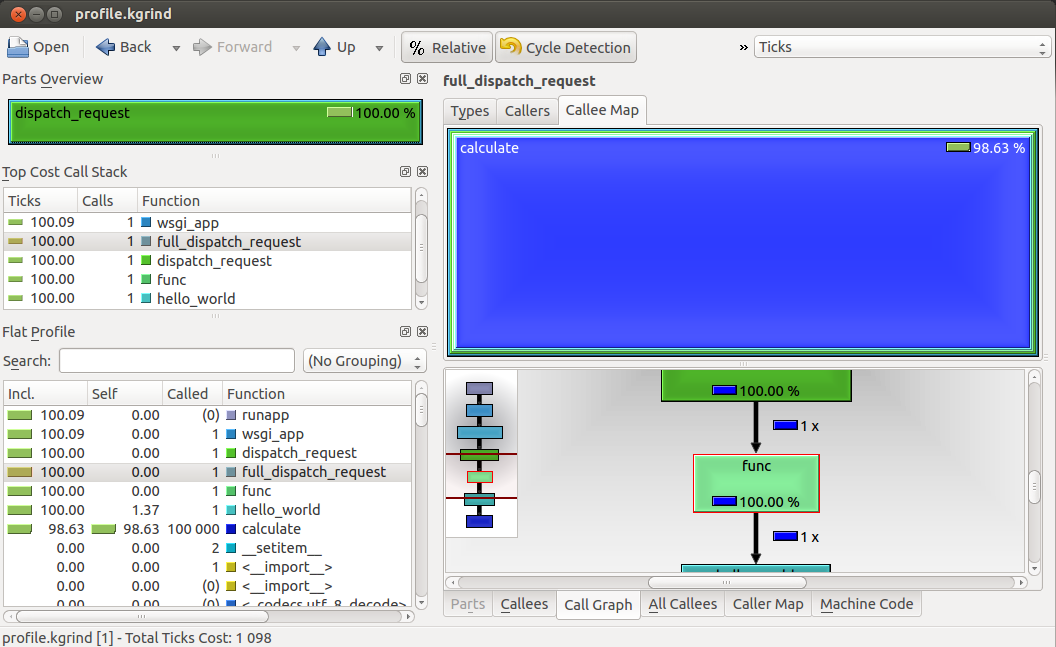
To get a better understanding what's going on within the application and to understand the flow and the performance impact of functions of your application, we used kcachegrind to visualize the call graph and the call map. To use kcachegrind you have to install it
sudo apt-get install kcachegrindand convert the profile data to the right output format. We are doing this in the discribed automated profile creation process. The script pyprof2calltree.py provides all necessary tools to make the conversion. This is basically how it works:
from pyprof2calltree import convert
convert('profile.prof', 'profile.kgrind')
With this file and kcachegrind you can visualize the profiling as the following screenshot illustrates:
kcachegrind is a great tool to actually use the profile data to improve the performance of the application. With it's various options and different visualizations you faster see the problems in your code.
####Memory profiling
You must install the python-dev package, the psutils module and the memory profiler module:
sudo apt-get install python-dev
sudo pip install psutil
sudo pip install memory_profiler
Then you can annotate the function you want to inspect:
@profile
@app.route('/memory')
def xrange_vs_range():
    xr = xrange(2**16)
	r  = range(2**16)

	return str(len(r))
And with the additional script
from app import app

@profile
def profiling():
    app.test_client().get('/memory')

profiling()
and the additional setting -m memory_profiler when starting the python interpreter
python -m memory_profiler profile_memory.pywe can trigger the memory profiling and get this result:
Filename: app.py

Line #    Mem usage    Increment   Line Contents
================================================
    24   15.523 MiB    0.000 MiB   @profile
    25                             @app.route('/memory')
    26                             def xrange_vs_range():
    27   15.527 MiB    0.004 MiB       xr = xrange(2**16)
    28   17.562 MiB    2.035 MiB   	r  = range(2**16)
    29
    30   17.562 MiB    0.000 MiB   	return len(r)


Filename: memory_profile.py

Line #    Mem usage    Increment   Line Contents
================================================
     3   15.156 MiB    0.000 MiB   @profile
     4                             def profiling():
     5                             	app.test_client().get('/memory')
This tool is perfect to find memory leaks in code handeling your requests. With the use of app.test_client() it works seamlessly with the flask framework.
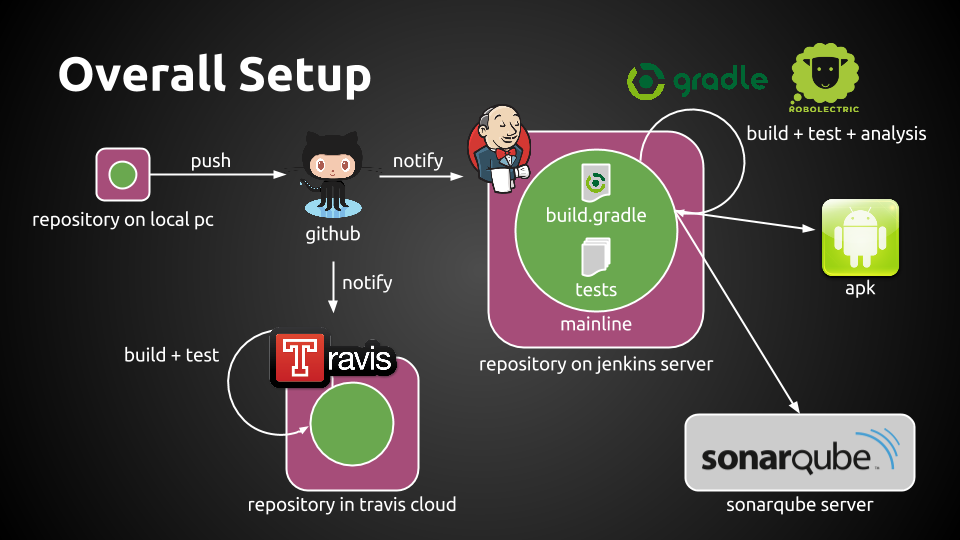
Have a look at the pdf CI_with_Android.pdf to get more information about this CI setup for Android:
There is more information about this topic at this location: https://github.com/friedolinfoerder/android-test


