The Rock Paper Scissors game project provides infrastructure, REST and gRPC APIs for the Rock Paper Scissors game.
The Rock Paper Scissors game project uses CQRS pattern. CQRS is an architectural pattern that can help maximize performance, scalability, and security. The pattern separates operations that read data from those operations that write data.
Source: Architecting Cloud Native .NET Applications for Azure
- Rock Paper Scissors game command microservice
- Rock Paper Scissors game query microservice
- Score command microservice
- Score query microservice
- Java 11 or higher
- OpenJDK 11 or higher
- Maven 3.6.3 or higher
- Spring Boot 2.6.1
- Lombok 1.18.20
- MapStruct
- Apache ZooKeeper 3.8.0
- Apache Kafka 2.7.0
- MongoDB NoSQL 4.4.22
- MariaDB Community Server 10.6.14
- H2 Database Engine
- OpenAPI 3.0
- gRPC framework 1.32.1
- Hibernate Validator
- Micrometer 1.8.0
- JUnit 5.8.2
- Mockito 3.9.0
- Spock 2.1
- Apache Groovy 3.0.9
- JaCoCo - unit and integration test coverage
- Flyway - database version control
- Prometheus - metrics database
- Grafana - metrics visualization
- ELK Stack - log aggregation and monitoring in a centralized way
- Redis - cache management
- Keycloak 18.0.0 - identity and access management server
** H2 in-memory database engine is used for it profile only
Local Machine
Microservices active profile is __dev__.
- OpenJDK 11 or higher
- Maven 3.6.0 or higher
- Keycloak 18.0.0
- MongoDB Community Edition
- Mongo Shell
- Apache ZooKeeper 3.8.0
- Apache Kafka 2.7.0
- Redis
- MariaDB Community Server 10.6.14
- Make sure you have OpenJDK 11 or a higher version installed using the following command:
> java -version
Windows 10
You should see the following output:
      openjdk version "11.0.19" 2023-04-18
      OpenJDK Runtime Environment Temurin-11.0.19+7 (build 11.0.19+7)
      OpenJDK 64-Bit Server VM Temurin-11.0.19+7 (build 11.0.19+7, mixed mode)
If not, follow the steps below to install it.
-
Download and extract OpenJDK11U-jdk_x64_windows_hotspot_11.0.19_7.zip archive file for Windows x64 from the Adoptium website.
-
Extract the contents of the OpenJDK11U-jdk_x64_windows_hotspot_11.0.19_7.zip archive file to a directory of your choice. D:\jdks for example.
-
Add/Update user environmental variables. Open a Command Prompt and set the value of the JAVA_HOME environment variable to your Eclipse Temurin OpenJDK 11 for Windows installation path:
> setx JAVA_HOME "D:\jdks\jdk-11.0.19+7"
- Add the bin directory contained in your Eclipse Temurin OpenJDK 11 for Windows installation path to the PATH environment variable:
> setx PATH "%JAVA_HOME%\bin;%PATH%;"
- Add/Update system environmental variables. Open a Command Prompt as Administrator and set the value of the JAVA_HOME environment variable to your Eclipse Temurin OpenJDK 11 for Windows installation path:
> setx -m JAVA_HOME "D:\jdks\jdk-11.0.19+7"
- Add the bin directory contained in your Eclipse Temurin OpenJDK 11 for Windows installation path to the PATH environment variable:
> setx -m PATH "%JAVA_HOME%\bin;%PATH%;"
Note: The setx command permanently updates the environment variables. To add/update system environment variables, you must use the -m switch and open the command prompt using Administrator privilege.
-
Restart the Command Prompt to reload the environment variables.
-
Finally, verify that the JAVA_HOME and PATH environment variables are set and Java is installed:
      > echo %JAVA_HOME%
      > echo %PATH%
      > java -version
Linux Ubuntu 20.04.6 LTS
You should see the following output:
      openjdk 11.0.19 2023-04-18
      OpenJDK Runtime Environment (build 11.0.19+7-post-Ubuntu-0ubuntu122.04.1)
      OpenJDK 64-Bit Server VM (build 11.0.19+7-post-Ubuntu-0ubuntu122.04.1, mixed mode, sharing)
If not, follow the steps below to install it.
- Install the Java Runtime Environment (JRE) from OpenJDK 11 or higher using the following commands:
> sudo apt install default-jre
Note: By default, Ubuntu 20.04 includes OpenJDK 11, which is an open-source variant of the JRE and JDK.
- You can have multiple Java installations on one machine. You can configure which version is the default for use on the command line by using the update-alternatives command:
> sudo update-alternatives --config java
You should see the following output:
    There is only one alternative in link group java (providing /usr/bin/java): /usr/lib/jvm/java-11-openjdk-amd64/bin/java
    Nothing to configure.
It means that we have only single Java installation, OpenJDK 11, on our machine and it's located at the /usr/lib/jvm/java-11-openjdk-amd64/bin/java directory. Note this directory as you will need it in the next step.
- Then open the /etc/environment file in any text editor, nano for example, using the following command:
> sudo nano /etc/environment
Modifying this file will set the environment variables for all users on your machine.
- At the end of the file, add the following line, making sure to replace Java path with yours obtained in the previous step:
JAVA_HOME="/usr/lib/jvm/java-11-openjdk-amd64"
Note: Do not include the bin/ portion of the Java installation location path to the JAVA_HOME
- Then reload this file to apply the changes to your current session with the following command:
> source /etc/environment
- Finally, verify that the JAVA_HOME environment variable is set and Java is installed:
      > echo $JAVA_HOME
      > java -version
- Make sure you have Maven or a higher version installed using the following command:
> mvn -version
Windows 10
You should see the following output:
      Apache Maven 3.9.3 (21122926829f1ead511c958d89bd2f672198ae9f)
      Maven home: D:\maven\apache-maven-3.9.3
      Java version: 11.0.19, vendor: Eclipse Adoptium, runtime: D:\jdks\jdk-11.0.19+7
      Default locale: ru_RU, platform encoding: Cp1251
      OS name: "windows 10", version: "10.0", arch: "amd64", family: "windows"
If not, follow the steps below to install it.
-
Download the apache-maven-3.9.3-bin.zip binary archive file from the Apache Maven Project website.
-
Extract the contents of the apache-maven-3.9.3-bin.zip archive file to a directory of your choice. D:\maven for example.
-
Add/Update user environmental variables. Open a Command Prompt and set the value of the M2_HOME environment variable for Windows installation path:
> setx M2_HOME "D:\maven\apache-maven-3.9.3"
- Add the bin directory contained in your apache-maven-3.9.3-bin.zip for Windows installation path to the PATH environment variable:
> setx PATH "%M2_HOME%\bin;%PATH%;"
- Add/Update system environmental variables. Open a Command Prompt as Administrator and set the value of the M2_HOME environment variable to your apache-maven-3.9.3-bin.zip for Windows installation path:
> setx -m M2_HOME "D:\maven\apache-maven-3.9.3"
- Add the bin directory contained in your apache-maven-3.9.3-bin.zip for Windows installation path to the PATH environment variable:
> setx -m PATH "%M2_HOME%\bin;%PATH%;"
-
Restart the Command Prompt to reload the environment variables.
-
Finally, verify that the M2_HOME and PATH environment variables are set and Maven is installed:
      > echo %M2_HOME%
      > echo %PATH%
      > mvn -version
Linux Ubuntu 20.04.6 LTS
You should see the following output:
      Apache Maven 3.9.3 (21122926829f1ead511c958d89bd2f672198ae9f)
      Maven home: /opt/apache-maven-3.9.3
      Java version: 11.0.19, vendor: Ubuntu, runtime: /usr/lib/jvm/java-11-openjdk-amd64
      Default locale: en, platform encoding: UTF-8
      OS name: "linux", version: "5.10.102.1-microsoft-standard-wsl2", arch: "amd64", family: "unix"
If not, follow the steps below to install it.
- Install Maven on you Linux Ubuntu machine by executing the following command:
> sudo apt install maven
If you want to install a specific version of Maven, follow steps below.
- Download the apache-maven-3.9.3-bin.tar.gz binary archive file from the Apache Maven Project website.
> wget https://dlcdn.apache.org/maven/maven-3/3.9.3/binaries/apache-maven-3.9.3-bin.tar.gz
- Once the download is completed, extract the downloaded file with the following commands:
> tar -xvzf apache-maven-3.9.3-bin.tar.gz
- Move the extracted files to the /opt directory with the following command:
> sudo mv apache-maven-3.9.3 /opt
- Remove the downloaded archive:
> rm apache-maven-3.9.3-bin.tar.gz
- Then open the /etc/environment file in nano text editor, using the following command:
> sudo nano /etc/environment
- At the end of the file, add the following line:
M2_HOME="/opt/apache-maven-3.9.3"
- Then reload this file to apply the changes to your current session with the following command:
> source /etc/environment
- Verify that the JAVA_HOME environment variable is set:
> echo $M2_HOME
You should see the following output:
/opt/apache-maven-3.9.3
- Add the bin directory contained in maven path to the PATH environment variable:
> export PATH="$M2_HOME/bin:$PATH"
- Then reload this file to apply the changes to your current session with the following command:
> source /etc/environment
- Finally, verify the Maven installation:
> mvn -version
You should see the following output:
      Apache Maven 3.9.3 (21122926829f1ead511c958d89bd2f672198ae9f)
      Maven home: /opt/apache-maven-3.9.3
      Java version: 11.0.19, vendor: Ubuntu, runtime: /usr/lib/jvm/java-11-openjdk-amd64
      Default locale: en, platform encoding: UTF-8
      OS name: "linux", version: "5.10.102.1-microsoft-standard-wsl2", arch: "amd64", family: "unix"
Docker Compose
Microservices active profile is __docker__.
- Make sure you have Docker Desktop installed using the following command:
> docker -v
You should see the following output:
Docker version 24.0.2, build cb74dfc
- If Docker Desktop is not installed navigate to the docker website download and install it on your local machine.
Windows 10
* Follow the installation instructions below to install [Docker Desktop](https://www.docker.com/products/docker-desktop) on Windows 10 machine:
Linux Ubuntu 20.04.6 LTS
* Follow the installation instructions below to install [Docker Desktop](https://www.docker.com/products/docker-desktop) on Linux Ubuntu machine:
- Docker Compose is also required. Docker Desktop includes Docker Compose along with Docker Engine and Docker CLI which are Compose prerequisites.
- Check if Docker Compose is installed:
> docker compose version
You should see the following output:
Docker Compose version v2.18.1
- Check if Docker Swarm mode is active. To check it, you can simply run the command:
> docker info
And check the status of the Swarm property.
Swarm: inactive
- If it is not active, you can simply run the command:
> docker swarm init
to activate it.
You should see the following output:
      Swarm initialized: current node (1ram5oln14qdk23b08eb5iv3q) is now a manager.

      To add a worker to this swarm, run the following command:

          docker swarm join --token SWMTKN-1-0im35q3hssq4ztnp2ftcq8dvyy4zg3sfhfg0twoo80iu8mhv6s-55g0y3u102p52rrunc6our8ji 192.168.1.106:2377

      To add a manager to this swarm, run 'docker swarm join-token manager' and follow the instructions.
- Launch Docker Desktop:
> systemctl --user start docker-desktop
-
Ensure that sufficient resources have been allocated to Docker Compose.
-
Set COMPOSE_PROJECT_NAME environmental variables:
Windows 10
> setx COMPOSE_PROJECT_NAME "rps-app"
Linux Ubuntu 20.04.6 LTS
    > export COMPOSE_PROJECT_NAME=rps-app
    > source /etc/environment
Mote: By default, the log file directory is:
Linux Ubuntu 20.04.6 LTS
_/var/lib/docker/containers/<container_id>_
on the host where the container is running.
Kubernetes
Microservices active profile is __prod__.
Make sure that k8s is enabled in the Docker Desktop. If not, click on the Settings icon, then on the Kubernetes tab and check the Enable Kubernetes checkbox.

You can also use minikube for local K8S development.
Make sure Minikube, kubectl and helm are installed.
kubectl installation
Minikube installation
Helm installation
How To Install Minikube on Ubuntu 22.04|20.04|18.04
How To Install Docker On Ubuntu 22.04 | 20.04
Start minikube cluster:
     > minikube start \
            --addons=ingress,dashboard \
            --cni=flannel \
            --install-addons=true \
                --kubernetes-version=stable \
                --vm-driver=docker --wait=false \
                --cpus=4 --memory=6g --nodes=1 \
                --extra-config=apiserver.service-node-port-range=1-65535 \
            --embed-certs \
            --no-vtx-check \
            --docker-env HTTP_PROXY=https://minikube.sigs.k8s.io/docs/reference/networking/proxy/
Note: The infrastructure clusters require significant resources (CPUs, memory). For example, I have the following server configuration:
     OS: Ubuntu 22.04.2 LTS (Jammy Jellyfish)
     Processor: Intel Xeon Processor (Icelake) 2GHz 16Mb
     vCPU: 4
     RAM: 32
Make sure Minikube is up and running with the following command:
> minikube status
You should see the following output:
      minikube
      type: Control Plane
      host: Running
      kubelet: Running
      apiserver: Running
      kubeconfig: Configured
Verify that metrics-server is installed by executing the following command:
> minikube addons list | grep metrics-server
If not, you should see the following output:
| metrics-server | minikube | disabled | Kubernetes
To install metrics-server on your K8S cluster, run:
> minikube addons enable metrics-server
You should see the following output:
      You can view the list of minikube maintainers at: https://github.com/kubernetes/minikube/blob/master/OWNERS
      - Using image registry.k8s.io/metrics-server/metrics-server:v0.6.3
      * The 'metrics-server' addon is enabled
Verify that metrics-server pod is up and running:
> kubectl get pods -n kube-system | grep metrics-server
You should see the following output:
metrics-server-6588d95b98-bdb6x 1/1 Running 0 2m35s
It means that metrics-server is up and running.
Now, if you run the following command:
> kubectl top pod -n rps-app-dev
You should see resources used in specified namespace:
      NAME                                           CPU(cores)   MEMORY(bytes)
      rps-cmd-service-deployment-59bc84c8-bcx4b      1m           573Mi
      rps-qry-service-deployment-9b4fbc8f6-vw58g     3m           590Mi
      score-cmd-service-deployment-676c56db8-rpfbc   1m           389Mi
Now that you are certain everything is up and running deploy the Kubernetes Dashboard with the command:
> minikube dashboard
If you want to access the K8S Dashboard from outside the cluster, run the following command:
> kubectl proxy --address='0.0.0.0' --accept-hosts='^*$'
And then access the K8S Dashboard in any browser:
http://<ip of your hosting server>:8001/api/v1/namespaces/kubernetes-dashboard/services/http:kubernetes-dashboard:/proxy/#/workloads?namespace=default
Open a Command Prompt and check if access is available for your Minikube cluster:
> kubectl cluster-info
You should see the following output:
      Kubernetes control plane is running at https://192.168.49.2:8443
      CoreDNS is running at https://192.168.49.2:8443/api/v1/namespaces/kube-system/services/kube-dns:dns/proxy

      To further debug and diagnose cluster problems, use 'kubectl cluster-info dump'.
Check the state of your Minikube cluster:
> kubectl get nodes
The output will list all of a cluster’s nodes and the version of Kubernetes each one is running.
      NAME       STATUS   ROLES           AGE     VERSION
      minikube   Ready    control-plane   7d14h   v1.26.3
You should see a single node in the output called minikube. That’s a full K8S cluster, with a single node.
First, we have to set up our infrastucture (backing services).
Local Machine
- Clone the rps-microservices project to your local machine by executing the following command:
> git clone https://github.com/hokushin118/rps-microservices.git
- Once the cloning is completed, go to the rps-microservices folder by executing the following command:
> cd rps-microservices
- Execute the mvn clean install command in the root directory of the project to build microservices and its dependencies locally.
> mvn clean install
Note: Each microservice and shared dependency should normally be hosted in its own git repository.
Keycloak is an open source authentication server that implements OpenID Connect (OIDC) and OAuth 2.0 standards. It's used to allow SSO (Single Sign-On) with identity and access management aimed at modern applications and services.
The Keycloak exposes endpoints to support standard functionality, including:
- Authorize (authenticate the end user)
- JWT Token (request a token programmatically)
- Discovery (metadata about the server)
- User Info (get user information with a valid access token)
- Device Authorization (used to start device flow authorization)
- Introspection (token validation)
- Revocation (token revocation)
- End Session (trigger single sign-out across all apps)
Keycloak is used to implement the following patterns:
Architecture Diagram

Source: Server Installation and Configuration Guide
In our setup (execpt local machine profile), we use PostgreSQL as a database for Keycloak to persist data such as users, clients and realms, but you can choose any other database from the list below.
Infinispan caches provide flexible, in-memory data stores that you can configure to suit use cases such as:
- Boosting application performance with high-speed local caches.
- Optimizing databases by decreasing the volume of write operations.
- Providing resiliency and durability for consistent data across clusters.
Local Machine
Window 10
-
Download and extract keycloak-18.8.0.zip archive file from the Keycloak website.
-
Import the rps-dev realm from the /infrastructure/keycloak/rps-dev-realm.json file by executing the following command:.
> bin\kc.bat import --dir <path to root directory>\rps-microservices\infrastructure\keycloak\ --override true
You should see the following line in the output:
2023-07-02 16:08:13,347 INFO [org.keycloak.exportimport.util.ImportUtils] (main) Realm 'rps-dev' imported
- To start the Keycloak 18.0.0 in development mode, run the following command:
> bin\kc.bat start-dev --http-port 8180
The Keycloak 18.0.0 will be started in dev mode on port number 8190.
Linux Ubuntu 20.04.6 LTS
* Ensure your system is updated:
> sudo apt update && sudo apt upgrade
- Download the keycloak-18.0.0.tar.gz archive file from the Keycloak website.
> wget https://github.com/keycloak/keycloak/releases/download/18.0.0/keycloak-18.0.0.tar.gz
- Once the download is completed, extract the downloaded file with the following commands:
> tar -xvzf keycloak-18.0.0.tar.gz
- Move the extracted files to the /opt/keycloak directory with the following command:
> sudo mv keycloak-18.0.0 /opt/keycloak
- Remove the downloaded archive:
> rm keycloak-18.0.0.tar.gz
- Then copy the Keycloak configuration file for H2 database with the following command:
> sudo cp ./infrastructure/linux/ubuntu/conf/keycloak.conf /opt/keycloak/conf/keycloak.conf
- Then open the /etc/environment file using the following command:
> sudo nano /etc/environment
- At the end of the file, add the following line and save the changes.
KEYCLOAK_HOME="/opt/keycloak"
- Then reload this file to apply the changes to your current session with the following command:
> source /etc/environment
- Finally, verify that the KEYCLOAK_HOME environment variable is set:
> echo $KEYCLOAK_HOME
You should see the following output:
/opt/keycloak
- Create a separate user account (service account) for the keycloak service using the following commands:
      > sudo useradd keycloak -m
      > sudo usermod --shell /bin/bash keycloak
Note: It is considered a best practice for using a separate service account for each application. The same can be said about creating a separate group for each service account.
- Add the user to the sudo group for it to have Administrative Privileges using the following command:
> sudo usermod -aG sudo keycloak
- To verify that the keycloak user has been added to the sudo group run the following command:
> id keycloak
You should see the following output:
> uid=998(keycloak) gid=1003(keycloak) groups=1003(keycloak),27(sudo)
It means that the keycloak user belongs to two groups: keycloak and sudo.
- Hide the account from the login screen:
> sudo /var/lib/AccountsService/users/keycloak
and add the following lines to the file:
            [User]
            SystemAccount=true
- Give the keycloak user ownership of the keycloak files by executing the following command:
> sudo chown -R keycloak:keycloak $KEYCLOAK_HOME
- Import the rps-dev realm from the _ /infrastructure/keycloak/rps-dev-realm.json_ file by executing the following command:
> sudo mkdir -p $KEYCLOAK_HOME/data/import && sudo cp ./infrastructure/keycloak/rps-dev-realm.json $KEYCLOAK_HOME/data/import/rps-dev-realm.json
You should see the following line in the output:
2023-07-02 16:08:13,347 INFO [org.keycloak.exportimport.util.ImportUtils] (main) Realm 'rps-dev' imported
Note: Skip the next step if you are going to run Keycloak 18.0.0 as systemd service.
- To start the Keycloak 18.0.0 in development mode, run the following command:
> sudo $KEYCLOAK_HOME/bin/kc.sh start-dev --import-realm --http-port 8180
The Keycloak 18.0.0 will be started in dev mode on port number 8190.
Note: When running in development mode, Keycloak 18.0.0 uses by default an H2 Database to store its configuration.
- You will need to create a systemd service file to manage the Keycloak service. You can copy the sample systemd service with the following command:
> sudo cp ./infrastructure/linux/ubuntu/systemd/keycloak.service /etc/systemd/system/keycloak.service
- Then, reload the systemd daemon to apply the changes by executing the following command:
> systemctl daemon-reload
- Then, start the keycloak service and enable it to start at system reboot by executing the following commands:
      > systemctl start keycloak
      > systemctl enable keycloak
- You can check the status of the keycloak service with the following command:
> systemctl status keycloak
You should see the following output:
    keycloak.service - The Keycloak IAM (Identity and Access Management) service
         Loaded: loaded (/etc/systemd/system/keycloak.service; disabled; vendor preset: enabled)
         Active: active (running) since Sun 2023-07-09 20:21:14 MSK; 43s ago
       Main PID: 128421 (java)
          Tasks: 55 (limit: 18682)
         Memory: 345.2M
         CGroup: /system.slice/keycloak.service
                 └─128421 java -Xms64m -Xmx512m -XX:MetaspaceSize=96M -XX:MaxMetaspaceSize=256m -Djava.net.preferIPv4Stack=true -Dkc.home.dir=/opt/keycloak/bin/../ -Djboss.server.config.dir=/opt/keycloak/bi>
You can also view the sys logs by executing the following command:
> cat /var/log/syslog
You should see the following lines in the sys log file:
Jul 9 20:27:14 hokushin-Latitude-3520 keycloak[128836]: 2023-07-09 20:27:14,589 WARN [org.keycloak.quarkus.runtime.KeycloakMain] (main) Running the server in development mode. DO NOT use this configuration in production.
- Open http://localhost:8180 and create a super user by filling the form with your preferred username and password.

For example:
| user name | password |
|---|---|
| admin | admin |
- Open Keycloak admin panel, enter super user credentials and make sure that rps-dev realm and test users has successfully been imported.
Keycloak Getting Started
How to export and import Realms in Keycloak
Docker Compose
- Then navigate to the root directory of the RPS Game project on your computer and run the Docker Compose command below to deploy Keycloak 18.0.0 on Docker Compose in the background:
> docker compose -f docker-compose-kc.yml up -d
You should see the following output:
    [+] Running 4/4
    ✔ Network rps_net                             Created     0.2s
    ✔ Volume "rps_app_postgresql-data"            Created     0.0s
    ✔ Container rps-app-postgresql-1              Started     2.0s
    ✔ Container rps-app-keycloak-1                Started     2.1s
- Verify that Keycloak 18.0.0 and PostgreSQL containers are up and running by executing the following command:
> docker compose -f docker-compose-kc.yml ps
You should see the following output:
    NAME                             IMAGE                                     COMMAND                  SERVICE             CREATED             STATUS              PORTS
    rps-app-keycloak-1    m          rps-app-keycloak                          "/opt/bitnami/keyclo…"   keycloak            2 minutes ago       Up 2 minutes        0.0.0.0:28080->8080/tcp
    rps-app-postgresql-1             bitnami/postgresql:14.2.0-debian-10-r95   "/opt/bitnami/script…"   postgresql          2 minutes ago       Up 2 minutes        0.0.0.0:15432->5432/tcp
It means that Keycloak 18.0.0 and PostgreSQL containers are up and running.
Note: Make sure that necessary external ports are not in use. If so, kill the processes by executing the following commands:
Windows 10
    > netstat -ano | findStr "<necessary external port>"
    > tasklist /fi "<pid of the proccess>"
Linux Ubuntu 20.04.6 LTS
> sudo fuser -k <necessary external port>/tcp
- Navigate to the keycloak microservice administration console:
> http://localhost:28080/admin
Enter credentials below:
| user name | password |
|---|---|
| admin | admin |
and make sure that rps-dev realm has been activated.
- When we don't need keycloak container anymore, we can take down containers and delete their corresponding volumes (-v) using the down command below:
> docker compose -f docker-compose-kc.yml down -v
Kubernetes
To create a kube-auth namespace on the K8S cluster, run:
> kubectl apply -f ./k8s/namespaces/kube-auth-ns.yml
To check the status, run:
> kubectl get namespaces --show-labels
You should see the following output:
      NAME                   STATUS   AGE     LABELS
      default                Active   10d     kubernetes.io/metadata.name=default
      ingress-nginx          Active   10d     app.kubernetes.io/instance=ingress-nginx,app.kubernetes.io/name=ingress-nginx,kubernetes.io/metadata.name=ingress-nginx
      kube-auth              Active   2d10h   kubernetes.io/metadata.name=kube-auth,name=kube-auth
      kube-cache             Active   3d16h   kubernetes.io/metadata.name=kube-cache,name=kube-cache
      kube-db                Active   6d19h   kubernetes.io/metadata.name=kube-db,name=kube-db
      kube-elk               Active   18h     kubernetes.io/metadata.name=kube-elk,name=kube-elk
      kube-kafka             Active   23s     kubernetes.io/metadata.name=kube-kafka,name=kube-kafka
      kube-monitoring        Active   29m     kubernetes.io/metadata.name=kube-monitoring,name=kube-monitoring
      kube-node-lease        Active   10d     kubernetes.io/metadata.name=kube-node-lease
      kube-nosql-db          Active   26h     kubernetes.io/metadata.name=kube-nosql-db,name=kube-nosql-db
      kube-public            Active   10d     kubernetes.io/metadata.name=kube-public
      kube-system            Active   10d     kubernetes.io/metadata.name=kube-system
      kubernetes-dashboard   Active   10d     addonmanager.kubernetes.io/mode=Reconcile,kubernetes.io/metadata.name=kubernetes-dashboard,kubernetes.io/minikube-addons=dashboard
Add a custom entry to the etc/hosts file using the nano text editor:
> sudo nano /etc/hosts
You should add the following ip address (copied in the previous step) and custom domain to the hosts file:
192.168.49.2 kc.internal
You may check the custom domain name with ping command:
> ping kc.internal
You should see the following output:
      PING kc.internal (192.168.49.2) 56(84) bytes of data.
      64 bytes from kc.internal (192.168.49.2): icmp_seq=1 ttl=64 time=0.064 ms
      64 bytes from kc.internal (192.168.49.2): icmp_seq=2 ttl=64 time=0.048 ms
      64 bytes from kc.internal (192.168.49.2): icmp_seq=3 ttl=64 time=0.056 ms
To create a Simple Fanout Ingress for the RPS microservices, run:
> kubectl apply -f ./k8s/ingress/kc-ingress.yml
Make sure the Keycloak ingress has been created:
> kubectl get ingress -n kube-auth
Note: Note for the ingress rule to take effect it needs to be created in the same namespace as the service.
You should see the following output:
      NAME               CLASS   HOSTS                                                                             ADDRESS        PORTS   AGE
      kc-ingress         nginx   kc.internal                                                                      192.168.49.2   80      12m
To deploy Keycloak on K8S cluster with PostgreSQL database execute the following command:
     > helm install keycloak \
            --set image.tag=18.0.0-debian-11-r7 \
            --set auth.adminUser=admin \
            --set auth.adminPassword=admin \
            --set auth.managementPassword=admin \
            --set postgresql.postgresqlPassword=admin \
            --set replicaCount=3 \
            oci://registry-1.docker.io/bitnamicharts/keycloak -n kube-auth
Keycloak helm chart parameters
Wait for some time until the chart is deployed. You should see the following output:
      Pulled: registry-1.docker.io/bitnamicharts/keycloak:15.1.3
      Digest: sha256:0ab81efa3f53a1535b2d8948a365d15518f3c42d094e86e84437b6d54b199796
      NAME: keycloak
      LAST DEPLOYED: Thu Jun 15 19:59:32 2023
      NAMESPACE: kube-auth
      STATUS: deployed
      REVISION: 1
      TEST SUITE: None
      NOTES:
      CHART NAME: keycloak
      CHART VERSION: 15.1.3
      APP VERSION: 21.1.1

      ** Please be patient while the chart is being deployed **

      Keycloak can be accessed through the following DNS name from within your cluster:

          keycloak.kube-auth.svc.cluster.local (port 80)

      To access Keycloak from outside the cluster execute the following commands:

      1. Get the Keycloak URL by running these commands:

          export HTTP_SERVICE_PORT=$(kubectl get --namespace kube-auth -o jsonpath="{.spec.ports[?(@.name=='http')].port}" services keycloak)
          kubectl port-forward --namespace kube-auth svc/keycloak ${HTTP_SERVICE_PORT}:${HTTP_SERVICE_PORT} &

          echo "http://127.0.0.1:${HTTP_SERVICE_PORT}/"

      2. Access Keycloak using the obtained URL.
      3. Access the Administration Console using the following credentials:

        echo Username: user
        echo Password: $(kubectl get secret --namespace kube-auth keycloak -o jsonpath="{.data.admin-password}" | base64 -d)
Note the service name displayed in the output, as you will need this in subsequent steps.
keycloak.kube-auth.svc.cluster.local (port 80)
Make sure that the Keycloak cluster is up and running with the following command:
> kubectl get pods -n kube-auth -o wide -w
It will take some time. You can use -w (--watch) flag to start watching updates to deployment.
You should see the following output:
      NAME                    READY   STATUS    RESTARTS   AGE     IP            NODE       NOMINATED NODE   READINESS GATES
      keycloak-0              1/1     Running   0          6m51s   10.244.0.14   minikube   <none>           <none>
      keycloak-1              1/1     Running   0          6m51s   10.244.0.14   minikube   <none>           <none>
      keycloak-2              1/1     Running   0          6m51s   10.244.0.14   minikube   <none>           <none>
      keycloak-postgresql-0   1/1     Running   0          6m50s   10.244.0.15   minikube   <none>           <none>
Note: To access the Keycloak server locally, we have to forward a local port 80 to the Kubernetes node running Keycloak with the following command:
> kubectl port-forward --address 0.0.0.0 service/keycloak 8080:80 -n kube-auth
To access the Keycloak Administration Console, open the following URL in the browser: http://kc.internal/admin
a) Click the word Master in the top-left corner, then click Add realm.

b) Enter rps-dev in the Add realm Name field then click the Create button.

Configure an Open ID Connect (OIDC) Client
Open ID Connect (OIDC) is a modern SSO (Single Sign-On) protocol built on top of the OAuth 2.0 Authorization Framework. Open ID Connect (OIDC) makes use of JWT (JSON Web Token) in the form of identity (contains information about the logged user such as the username and the email) and access (contains access data such as the roles) tokens.
With the new realm created, let's create a client that is an application or group of applications that will authenticate in this Realm.
a) Click Clients menu item in the left navigation bar and then click the Create button.
b) Enter the Client ID. The Client ID is a string used to identify our client. We will use oauth2-proxy.
c) Select the Client Protocol openid-connect from the drop-down menu and click the Save button.
d) From the Access Type drop-down menu, select confidential option. This is the access type for server-side applications.

e) In the Valid Redirect URIs box, you can add multiple URLs that are valid to be redirected after the authentication. If this oauth2-proxy client will be used for multiple applications on your cluster, you can add a wildcard like https://your-domain.com/*. In my configuration, I've added http://rps.internal/* and https://rps.internal/*.
f) Confirm that the Standard Flow Enabled and Direct Access Grants Enabled toggle buttons are enabled. The __ Standard Flow Enabled__ property is used to activate the Authorization Code Flow .
g) Turn on the Service Accounts Enabled toggle button.
h) Turn on the Implicit Flow Enabled toggle button. It's required for OpenAPI 3.0 OAuth 2.0 authentication.
i) Click the Save button to persist changes.

The webpage will automatically be refreshed, and you will see a new tab called Credentials. Click on the __ Credentials__ tab and copy the value of the Secret textbox as you will need this in the next steps.
H0fnsBnCc7Ts22rxhvLcy66s1yvzSRgG

That's it. We have created a client that we can use to authenticate the users visiting our application.
Now when you have the client secret value for OAuth2 Client oauth2-proxy, you can request an access token using the client-credentials grant type, execute the following command:
      > curl --location --request POST "http://kc.internal/realms/rps-dev/protocol/openid-connect/token" \
             --header "Content-Type: application/x-www-form-urlencoded" \
             --data-urlencode "grant_type=client_credentials" \
             --data-urlencode "client_id=oauth2-proxy" \
             --data-urlencode "client_secret=HVxWhjNes0vU3FyxETpmBcYXyV0WVAgw"
You will get an access token that you can use with Keycloak REST API:
      {
        "access_token":"eyJhbGciOiJSUz...",
        "expires_in":300,
        "refresh_expires_in":0,
        "token_type":"Bearer",
        "not-before-policy":0,
        "scope":"profile email"
      }
Keycloak Server OIDC URI Endpoints
For example, you can get the user info executing the following command:
      > curl --location --request GET "http://kc.internal/realms/rps-dev/protocol/openid-connect/userinfo" \
             --header "Content-Type: application/x-www-form-urlencoded" \
             --header "Authorization: Bearer <access token obtained in the previous step>" \
             --data-urlencode "grant_type=client_credentials" \
             --data-urlencode "client_id=oauth2-proxy" \
             --data-urlencode "client_secret=HVxWhjNes0vU3FyxETpmBcYXyV0WVAgw"
Groups mapper
a) Select the Mappers tab on the Create Protocol Mapper page, add a new mapper and enter all the groups using the following settings:
b) Enter the Name. We will use groups.
c) From the Mapper Type drop-down menu, select Group Membership option.
d) Enter the Token Claim Name. We will use groups.
e) Turn off the Full group path toggle button.
f) Click the Save button to persist changes.

Audience mapper
a) Select the Mappers tab on the Create Protocol Mapper page, add a new mapper and enter all the groups using the following settings:
b) Enter the Name. We will use audience.
c) From the Mapper Type drop-down menu, select Audience option.
d) From the Included Client Audience drop-down menu, select oauth2-proxy option.
e) Click the Save button to persist changes.

- Create an admin role
a) Click the Roles menu item in the left navigation bar and then click the Add Role button.
b) Enter ROLE_ADMIN as Role Name and click the Save button.

- Create a general user and moderator roles
Repeat the same steps for the ROLE_USER and ROLE_MODERATOR roles.
| role name | description |
|---|---|
| ROLE_ADMIN | Admin user |
| ROLE_MODERATOR | Moderator user |
| ROLE_USER | General user |
In Keycloak , Groups are just a collection of users that you can apply roles and attributes to in one place.
- Create an admin group
a) Click the Groups menu item in the left navigation bar and then click the New button:
b) Enter admins as Name and click the Save button to persist changes.

b) Assign appropriate roles to the created group.
- Create moderators and users groups
Repeat the same steps for moderators and users groups.
| group name | roles |
|---|---|
| admins | ROLE_ADMIN |
| moderators | ROLE_MODERATOR |
| users | ROLE_USER |
- Create an admin user
a) Click the Users menu item in the left navigation bar and then click the Add user button.
b) Enter admin as username, an email address and a password for the new user, and add the user to the users, _ moderators_ and admins groups.
c) Turn on the Email Verified toggle button.
User Details:
| property | value |
|---|---|
| Username | admin |
| [email protected] | |
| User Enabled | ON |
| Email Verified | ON |
| Groups | admins moderators users |
User Credentials:
| property | value |
|---|---|
| Password | admin |
| Temporary | OFF |

d) Set password for the new user.

- Create a general user
Repeat the same steps for test user. Add the test user to the user group only.
User Details:
| property | value |
|---|---|
| Username | test |
| [email protected] | |
| User Enabled | ON |
| Email Verified | ON |
| Groups | users |
User Credentials:
| property | value |
|---|---|
| Password | test |
| Temporary | OFF |

Update the application Keycloak properties in the microservices application-.yml files.
| property | value |
|---|---|
| hostname | kc.internal |
| port | 8180 |
| realm | rps-dev |
| client-id | oauth2-proxy |
| secret | H0fnsBnCc7Ts22rxhvLcy66s1yvzSRgG |
Spring Security - OAuth2 configuration
TODO: grpc security configuration
That's it! Microservices infrastructure backing services is up and running. We can start deploying microservices.
Local Machine
Window 10
-
Download and install MongoDB Community Edition from official website.
-
Download and install Mongo Shell from official website.
Linux Ubuntu 20.04.6 LTS
* Ensure your system is updated:
> sudo apt update && sudo apt upgrade
- First, import GPK key for the MongoDB apt repository on your system using the following command:
> sudo apt-key adv --keyserver hkp://keyserver.ubuntu.com:80 --recv 656408E390CFB1F5
Then add MongoDB APT repository url in /etc/apt/sources.list.d/mongodb.list using the following command:
> echo "deb [ arch=amd64,arm64 ] https://repo.mongodb.org/apt/ubuntu focal/mongodb-org/4.4 multiverse" | sudo tee /etc/apt/sources.list.d/mongodb-org-4.4.list
- And then, install MongoDB on your computer using the following commands:
      > sudo apt update
      > sudo apt install mongodb-org=4.4.22 mongodb-org-server=4.4.22 mongodb-org-shell=4.4.22 mongodb-org-mongos=4.4.22 mongodb-org-tools=4.4.22
- After installation, MongoDB should start automatically. if not, enable and start it using the following commands:
      > sudo systemctl enable mongod.service
      > sudo systemctl start mongod.service
- Check the status using the following command:
> sudo systemctl status mongod.service
- Finally, check installed MongoDB version using the following command:
> mongod --version
You should see the following output:
      db version v4.4.22
      Build Info: {
          "version": "4.4.22",
          "gitVersion": "fc832685b99221cffb1f5bb5a4ff5ad3e1c416b2",
          "openSSLVersion": "OpenSSL 1.1.1f  31 Mar 2020",
          "modules": [],
          "allocator": "tcmalloc",
          "environment": {
              "distmod": "ubuntu2004",
              "distarch": "x86_64",
              "target_arch": "x86_64"
          }
      }
- Install Mongo Shell on your computer using the following commands:
> sudo apt install mongodb-mongosh=1.1.9
- To prevent unintended upgrades, you can pin the package at the currently installed version:
      echo "mongodb-org hold" | sudo dpkg --set-selections
      echo "mongodb-org-server hold" | sudo dpkg --set-selections
      echo "mongodb-mongosh hold" | sudo dpkg --set-selections
      echo "mongodb-org-mongos hold" | sudo dpkg --set-selections
      echo "mongodb-org-tools hold" | sudo dpkg --set-selections
- You can stop MongoDB service by executing the following command:
> sudo service mongod stop
Windows 10 and Linux Ubuntu 20.04.6 LTS
- Open the command line tool and type the following command:
> mongosh
You should see the following output:
      C:\Users\qdotn>mongosh
      Current Mongosh Log ID: 649feb5649fae114f896e903
      Connecting to:          mongodb://127.0.0.1:27017/?directConnection=true&serverSelectionTimeoutMS=2000&appName=mongosh+1.1.9
      Using MongoDB:          4.4.22
      Using Mongosh:          1.1.9

      For mongosh info see: https://docs.mongodb.com/mongodb-shell/


      To help improve our products, anonymous usage data is collected and sent to MongoDB periodically (https://www.mongodb.com/legal/privacy-policy).
      You can opt-out by running the disableTelemetry() command.

      ------
      The server generated these startup warnings when booting:
      2023-06-30T21:50:40.581+03:00: Access control is not enabled for the database. Read and write access to data and configuration is unrestricted
      ------

      test>
It means that Mongo Shell has successfully been started:
- Change database to admin by executing the following command in Mongo Shell:
> use admin
You should see the following output:
switched to db admin
- To create a root user with root build-in role execute the following command in Mongo Shell:
      > db.createUser(
        {
            user: "root",
            pwd: "mongo12345",
            roles: [ "root" ]
        })
You should see the following output:
{ ok: 1 }
It means that user root user with build-in root role has successfully been created.
| user name | password | role |
|---|---|---|
| root | mongo12345 | root |
MongoDB build-in roles
Windows 10
* Download and install [MariaDB Community Server](https://mariadb.com/downloads) version 10.6.14-GA for MS Windows (64-bit) from official website.
Enter 12345 as root password. Enable the Enable access from remote machines for 'root' user checkbox.
| user name | password |
|---|---|
| root | 12345 |

Enable the Install as service checkbox.

Linux Ubuntu 20.04.6 LTS
* Ensure your system is updated and install software-properties-common package:
      > sudo apt update && sudo apt upgrade
      > sudo apt -y install software-properties-common
- First, we will add the official MariaDB apt repository using the following command:
> curl -LsS https://r.mariadb.com/downloads/mariadb_repo_setup | sudo bash -s -- --mariadb-server-version="mariadb-10.6"
Then, install MariaDB server and client.using the following command:
> sudo apt-get install mariadb-server mariadb-client -y
- Check the status using the following command:
> sudo systemctl status mariadb
- Finally, check installed MariaDB version using the following command:
> mysql -V
You should see the following output:
mysql Ver 15.1 Distrib 10.6.14-MariaDB, for debian-linux-gnu (x86_64) using readline 5.2
- To prevent unintended upgrades, you can pin the package at the currently installed version:
      > echo "mariadb-server hold" | sudo dpkg --set-selections
      > echo "mariadb-client hold" | sudo dpkg --set-selections
- After installation, secure MariaDB using the following commands:
> sudo mysql_secure_installation
You will be prompted with several questions. Choose options as shown below.
| question | answer |
|---|---|
| Enter current password for root (enter for none) | |
| Switch to unux_socket authentication [Y/n] | Y |
| Change the root password? [Y/n] | Y |
| New password: | 12345 |
| Re-enter new password: | 12345 |
| Remove anonymous users? [Y/n] | Y |
| Disallow root login remotely? [Y/n] | n |
| Remove the test database and access to it? [Y/n] | Y |
| Reload privilege tables now? [Y/n] | Y |
- You can stop MariaDB service by executing the following command:
> sudo service mariadb stop
Windows 10 and Linux Ubuntu 20.04.6 LTS
- Validate the configurations by connecting to MariaDB:
> mysql -u root -p
You will be prompted with password. Enter root password of 12345.
Windows 10
* To install [Redis](https://redis.io) on Windows, we'll first need to [enable WSL2 (Windows Subsystem for Linux)](https://learn.microsoft.com/en-us/windows/wsl/install).
You can a list of available Linux distros by executing the following command in Windows PowerShell:
> wsl --list --online
You'll see the following output:
      NAME                                   FRIENDLY NAME
      Ubuntu                                 Ubuntu
      Debian                                 Debian GNU/Linux
      kali-linux                             Kali Linux Rolling
      Ubuntu-18.04                           Ubuntu 18.04 LTS
      Ubuntu-20.04                           Ubuntu 20.04 LTS
      Ubuntu-22.04                           Ubuntu 22.04 LTS
      OracleLinux_7_9                        Oracle Linux 7.9
      OracleLinux_8_7                        Oracle Linux 8.7
      OracleLinux_9_1                        Oracle Linux 9.1
      openSUSE-Leap-15.5                     openSUSE Leap 15.5
      SUSE-Linux-Enterprise-Server-15-SP4    SUSE Linux Enterprise Server 15 SP4
      SUSE-Linux-Enterprise-Server-15-SP5    SUSE Linux Enterprise Server 15 SP5
      openSUSE-Tumbleweed                    openSUSE Tumbleweed
- Then you can install your favorite distro from the list by executing the following command:
> wsl --install -d <DistroName>
for example:
> wsl --install -d Ubuntu-20.04
- And then you can install Redis on your Linux distro (I am using Ubuntu) by executing the following commands:
      > curl -fsSL https://packages.redis.io/gpg | sudo gpg --dearmor -o /usr/share/keyrings/redis-archive-keyring.gpg
      > echo "deb [signed-by=/usr/share/keyrings/redis-archive-keyring.gpg] https://packages.redis.io/deb $(lsb_release -cs) main" | sudo tee /etc/apt/sources.list.d/redis.list
      > sudo apt-get update
      > sudo apt-get install redis
      > sudo service redis-server start
Linux Ubuntu 20.04.6 LTS
* Ensure your system is updated:
> sudo apt update && sudo apt upgrade
- Install Redis on your Linux Ubuntu 20.04.6 LTS machine by executing the following commands:
      > curl -fsSL https://packages.redis.io/gpg | sudo gpg --dearmor -o /usr/share/keyrings/redis-archive-keyring.gpg
      > echo "deb [signed-by=/usr/share/keyrings/redis-archive-keyring.gpg] https://packages.redis.io/deb $(lsb_release -cs) main" | sudo tee /etc/apt/sources.list.d/redis.list
      > sudo apt-get update
      > sudo apt-get install redis
      > sudo service redis-server start
Note: By default, Redis is accessible only from localhost.
- To prevent unintended upgrades, you can pin the package at the currently installed version:
> echo "redis hold" | sudo dpkg --set-selections
- Verify the status of the redis package by executing the following command:
> dpkg --get-selections redis
You should see the following output:
> redis hold
- You can stop Redis service by executing the following command:
> sudo service redis-server stop
Docker Desktop
- Navigate (if it's not already in) to the root directory of the RPS Game project on your computer and run the Docker Compose command below to deploy standalone database servers on Docker Compose in the background:
> docker compose -f docker-compose-general.yml up -d
You should see the following output:
    [+] Running 3/3
     ✔ Container rps-app-redis-1    Started     0.0s
     ✔ Container rps-app-mongodb-1  Started     0.0s
     ✔ Container rps-app-mariadb-1  Started     0.0s
- Verify that MongoDB, MariaDB and Redis containers are up and running by executing the following command:
> docker compose -f docker-compose-general.yml ps
You should see the following output:
    NAME                             IMAGE                                     COMMAND                  SERVICE             CREATED             STATUS              PORTS
    rps-app-mariadb-1                bitnami/mariadb:10.6                      "/opt/bitnami/script…"   mariadb             6 minutes ago       Up 5 minutes        0.0.0.0:13306->3306/tcp
    rps-app-mongodb-1                mongo:4.4                                 "docker-entrypoint.s…"   mongo               6 minutes ago       Up 5 minutes        0.0.0.0:28017->27017/tcp
    rps-app-redis-1                  bitnami/redis:4.0.9-r24                   "/app-entrypoint.sh …"   cache               6 minutes ago       Up 5 minutes        0.0.0.0:16379->6379/tcp
It means that MongoDB, MariaDB and Redis containers are up and running.
- When we don't need database containers anymore, we can take down containers and delete their corresponding volumes (-v) using the down command below:
> docker compose -f docker-compose-general.yml down -v
Kubernetes
MariaDB Server is one of the most popular open source relational databases.
MongoDB is used to implement the following patterns:
To create a kube-db namespace on the k8s cluster, run:
> kubectl apply -f ./k8s/namespaces/kube-db-ns.yml
To check the status, run:
> kubectl get namespaces --show-labels
You should see the following output:
      NAME                   STATUS   AGE     LABELS
      default                Active   2d13h   kubernetes.io/metadata.name=default
      ingress-nginx          Active   2d13h   app.kubernetes.io/instance=ingress-nginx,app.kubernetes.io/name=ingress-nginx,kubernetes.io/metadata.name=ingress-nginx
      kube-db                Active   99m     kubernetes.io/metadata.name=kube-db,name=kube-db
      kube-elk               Active   2d12h   kubernetes.io/metadata.name=kube-elk,name=kube-elk
      kube-node-lease        Active   2d13h   kubernetes.io/metadata.name=kube-node-lease
      kube-public            Active   2d13h   kubernetes.io/metadata.name=kube-public
      kube-system            Active   2d13h   kubernetes.io/metadata.name=kube-system
      kubernetes-dashboard   Active   2d13h   addonmanager.kubernetes.io/mode=Reconcile,kubernetes.io/metadata.name=kubernetes-dashboard,kubernetes.io/minikube-addons=dashboard
To deploy MariaDB cluster to Kubernetes, first run:
> kubectl apply -f ./k8s/rbacs/mariadb-rbac.yml
Then run:
> kubectl apply -f ./k8s/configmaps/mariadb-configmap.yml
Then deploy a headless service for MariaDB pods using the following command:
> kubectl apply -f ./k8s/services/mariadb-svc.yml
Note: You cannot directly access the application running in the pod. If you want to access the application, you need a Service object in the Kubernetes cluster.
Headless service means that only internal pods can communicate with each other. They are not exposed to external requests outside the Kubernetes cluster. Headless services expose the individual pod IPs instead of the service IP and should be used when client applications or pods want to communicate with specific (not randomly selected) pod (stateful application scenarios).
Get the list of running services under the kube-db namespace with the following command:
> kubectl get service -n kube-db
You should see the following output:
      NAME          TYPE        CLUSTER-IP   EXTERNAL-IP   PORT(S)    AGE
      mariadb-svc   ClusterIP   None         <none>        3306/TCP   113s
Then run:
> kubectl apply -f ./k8s/secrets/mariadb-secret.yml
Now the secrets can be referenced in our statefulset. And then run:
> kubectl apply -f ./k8s/sets/mariadb-statefulset.yml
To monitor the deployment status, run:
> kubectl rollout status sts/mariadb-sts -n kube-db
You should see the following output:
partitioned roll out complete: 3 new pods have been updated...
To check the pod status, run:
> kubectl get pods -n kube-db
You should see the following output:
      NAME            READY   STATUS    RESTARTS   AGE
      mariadb-sts-0   1/1     Running   0          108s
      mariadb-sts-1   1/1     Running   0          105s
      mariadb-sts-2   1/1     Running   0          102s
At this point, your MariaDB cluster is ready for work. Test it as follows:
Create data on first (primary) replica set member with these commands:
> kubectl -n kube-db exec -it mariadb-sts-0 -- mariadb -uroot -p12345
You should see the following output:
      Defaulted container "mariadb" out of: mariadb, init-mariadb (init)
      Welcome to the MariaDB monitor.  Commands end with ; or \g.
      Your MariaDB connection id is 6
      Server version: 10.11.3-MariaDB-1:10.11.3+maria~ubu2204-log mariadb.org binary distribution

      Copyright (c) 2000, 2018, Oracle, MariaDB Corporation Ab and others.

      Type 'help;' or '\h' for help. Type '\c' to clear the current input statement.

      MariaDB [(none)]> show databases;
      +--------------------+
      | Database           |
      +--------------------+
      | information_schema |
      | mysql              |
      | performance_schema |
      | primary_db         |
      | sys                |
      +--------------------+
      5 rows in set (0.001 sec)

      MariaDB [(none)]> use primary_db;
      Database changed
      MariaDB [primary_db]> create table my_table (t int); insert into my_table values (5),(15),(25);
      Query OK, 0 rows affected (0.041 sec)

      Query OK, 3 rows affected (0.007 sec)
      Records: 3  Duplicates: 0  Warnings: 0
      MariaDB [primary_db]> exit
      Bye
Check data on second (secondary) replica set member with these commands:
> kubectl -n kube-db exec -it mariadb-sts-1 -- mariadb -uroot -p12345
You should see the following output:
      Defaulted container "mariadb" out of: mariadb, init-mariadb (init)
      Welcome to the MariaDB monitor.  Commands end with ; or \g.
      Your MariaDB connection id is 6
      Server version: 10.11.3-MariaDB-1:10.11.3+maria~ubu2204 mariadb.org binary distribution

      Copyright (c) 2000, 2018, Oracle, MariaDB Corporation Ab and others.

      Type 'help;' or '\h' for help. Type '\c' to clear the current input statement.

      MariaDB [(none)]> show databases;
      +--------------------+
      | Database           |
      +--------------------+
      | information_schema |
      | mysql              |
      | performance_schema |
      | primary_db         |
      | sys                |
      +--------------------+
      5 rows in set (0.001 sec)

      MariaDB [(none)]> use primary_db;
      Database changed
      MariaDB [primary_db]> show tables;
      +----------------------+
      | Tables_in_primary_db |
      +----------------------+
      | my_table             |
      +----------------------+
      1 row in set (0.000 sec)
      MariaDB [primary_db]> select * from my_table;
      +------+
      | t    |
      +------+
      |    5 |
      |   15 |
      |   25 |
      +------+
      3 rows in set (0.000 sec)
Repeat the same steps for the third (secondary) replica set member by changing the name of the pod to mariadb-sts-2.
MongoDB is a source-available cross-platform document-oriented database program.
MongoDB is used to implement the following patterns:
To create a kube-nosql-db namespace on the k8s cluster, run:
> kubectl apply -f ./k8s/namespaces/kube-nosql-db-ns.yml
To check the status, run:
> kubectl get namespaces --show-labels
You should see the following output:
      NAME                   STATUS   AGE     LABELS
      default                Active   2d13h   kubernetes.io/metadata.name=default
      ingress-nginx          Active   2d13h   app.kubernetes.io/instance=ingress-nginx,app.kubernetes.io/name=ingress-nginx,kubernetes.io/metadata.name=ingress-nginx
      kube-db                Active   99m     kubernetes.io/metadata.name=kube-db,name=kube-db
      kube-elk               Active   2d12h   kubernetes.io/metadata.name=kube-elk,name=kube-elk
      kube-node-lease        Active   2d13h   kubernetes.io/metadata.name=kube-node-lease
      kube-nosql-db          Active   3m5s    kubernetes.io/metadata.name=kube-nosql-db,name=kube-nosql-db
      kube-public            Active   2d13h   kubernetes.io/metadata.name=kube-public
      kube-system            Active   2d13h   kubernetes.io/metadata.name=kube-system
      kubernetes-dashboard   Active   2d13h   addonmanager.kubernetes.io/mode=Reconcile,kubernetes.io/metadata.name=kubernetes-dashboard,kubernetes.io/minikube-addons=dashboard
To deploy MongoDB cluster to Kubernetes, first run:
> kubectl apply -f ./k8s/rbacs/mongodb-rbac.yml
Then run:
> kubectl apply -f ./k8s/configmaps/mongodb-configmap.yml
Then deploy a headless service for MongoDB pods using the following command:
> kubectl apply -f ./k8s/services/mongodb-svc.yml
Note: You cannot directly access the application running in the pod. If you want to access the application, you need a Service object in the Kubernetes cluster.
Headless service means that only internal pods can communicate with each other. They are not exposed to external requests outside the Kubernetes cluster. Headless services expose the individual pod IPs instead of the service IP and expose the individual pod IPs instead of the service IP and should be used when client applications or pods want to communicate with specific (not randomly selected) pod (stateful application scenarios).
Get the list of running services under the kube-nosql-db namespace with the following command:
> kubectl get service -n kube-nosql-db
You should see the following output:
      NAME          TYPE        CLUSTER-IP   EXTERNAL-IP   PORT(S)     AGE
      mongodb-svc   ClusterIP   None         <none>        27017/TCP   2m36s
Then run:
> kubectl apply -f ./k8s/secrets/mongodb-secret.yml
Now the secrets can be referenced in our statefulset. And then run:
> kubectl apply -f ./k8s/sets/mongodb-statefulset.yml
To monitor the deployment status, run:
> kubectl rollout status sts/mongodb-sts -n kube-nosql-db
You should see the following output:
      Waiting for 3 pods to be ready...
      Waiting for 2 pods to be ready...
      Waiting for 1 pods to be ready...
      partitioned roll out complete: 3 new pods have been updated...
To check the pod status, run:
> kubectl get pods -n kube-nosql-db -o wide
You should see the following output:
      NAME            READY   STATUS    RESTARTS   AGE   IP            NODE       NOMINATED NODE   READINESS GATES
      mongodb-sts-0   2/2     Running   0          85s   10.244.0.8    minikube   <none>           <none>
      mongodb-sts-1   2/2     Running   0          62s   10.244.0.9    minikube   <none>           <none>
      mongodb-sts-2   2/2     Running   0          58s   10.244.0.10   minikube   <none>           <none>
Connect to the first replica set member with this command:
> kubectl -n kube-nosql-db exec -it mongodb-sts-0 -- mongo
You should see the following output:
      Defaulted container "mongodb" out of: mongodb, mongo-sidecar
      MongoDB shell version v4.4.21
      connecting to: mongodb://127.0.0.1:27017/?compressors=disabled&gssapiServiceName=mongodb
      Implicit session: session { "id" : UUID("c3a2b74c-75f0-4288-9deb-30a7d0bc4bd6") }
      MongoDB server version: 4.4.21
      ---
      The server generated these startup warnings when booting:
      2023-05-27T10:11:59.717+00:00: Using the XFS filesystem is strongly recommended with the WiredTiger storage engine. See http://dochub.mongodb.org/core/prodnotes-filesystem
      2023-05-27T10:12:00.959+00:00: Access control is not enabled for the database. Read and write access to data and configuration is unrestricted
      2023-05-27T10:12:00.960+00:00: You are running this process as the root user, which is not recommended
      ---
      ---
              Enable MongoDB's free cloud-based monitoring service, which will then receive and display
              metrics about your deployment (disk utilization, CPU, operation statistics, etc).

              The monitoring data will be available on a MongoDB website with a unique URL accessible to you
              and anyone you share the URL with. MongoDB may use this information to make product
              improvements and to suggest MongoDB products and deployment options to you.

              To enable free monitoring, run the following command: db.enableFreeMonitoring()
              To permanently disable this reminder, run the following command: db.disableFreeMonitoring()
      ---
You now have a REPL environment connected to the MongoDB database. Initiate the replication by executing the following command:
> rs.initiate()
If you get the following output:
      {
              "operationTime" : Timestamp(1685727395, 1),
              "ok" : 0,
              "errmsg" : "already initialized",
              "code" : 23,
              "codeName" : "AlreadyInitialized",
              "$clusterTime" : {
                      "clusterTime" : Timestamp(1685727395, 1),
                      "signature" : {
                              "hash" : BinData(0,"AAAAAAAAAAAAAAAAAAAAAAAAAAA="),
                              "keyId" : NumberLong(0)
                      }
              }
      }
Define the variable called cfg. The variable executes rs.conf() command:
> cfg = rs.conf()
Use the cfg variable to add the replica set members to the configuration:
      > cfg.members = [{_id: 0, host: "mongodb-sts-0.mongodb-svc.kube-nosql-db"},
                       {_id: 1, host: "mongodb-sts-1.mongodb-svc.kube-nosql-db", priority: 0},
                       {_id: 2, host: "mongodb-sts-2.mongodb-svc.kube-nosql-db", priority: 0}]
You should see the following output:
[
        {
                "_id" : 0,
                "host" : "mongodb-sts-0.mongodb-svc.kube-nosql-db"
        },
        {
                "_id" : 1,
                "host" : "mongodb-sts-1.mongodb-svc.kube-nosql-db",
                "priority": 0
        },
        {
                "_id" : 2,
                "host" : "mongodb-sts-2.mongodb-svc.kube-nosql-db",
                "priority": 0
        }
]
Confirm the configuration by executing the following command:
> rs.reconfig(cfg, {force: true})
You should see the following output:
      {
        ok: 1,
        '$clusterTime': {
          clusterTime: Timestamp({ t: 1684949311, i: 1 }),
          signature: {
            hash: Binary(Buffer.from("0000000000000000000000000000000000000000", "hex"), 0),
            keyId: Long("0")
          }
        },
        operationTime: Timestamp({ t: 1684949311, i: 1 })
      }
Verify MongoDB replication status with this command:
> rs.status()
You should see the following output:
      {
              "set" : "rs0",
              "date" : ISODate("2023-05-27T10:14:52.096Z"),
              "myState" : 1,
              "term" : NumberLong(1),
              "syncSourceHost" : "",
              "syncSourceId" : -1,
              "heartbeatIntervalMillis" : NumberLong(2000),
              "majorityVoteCount" : 2,
              "writeMajorityCount" : 2,
              "votingMembersCount" : 3,
              "writableVotingMembersCount" : 3,
              "optimes" : {
                      "lastCommittedOpTime" : {
                              "ts" : Timestamp(1685182483, 1),
                              "t" : NumberLong(1)
                      },
                      "lastCommittedWallTime" : ISODate("2023-05-27T10:14:43.714Z"),
                      "readConcernMajorityOpTime" : {
                              "ts" : Timestamp(1685182483, 1),
                              "t" : NumberLong(1)
                      },
                      "readConcernMajorityWallTime" : ISODate("2023-05-27T10:14:43.714Z"),
                      "appliedOpTime" : {
                              "ts" : Timestamp(1685182483, 1),
                              "t" : NumberLong(1)
                      },
                      "durableOpTime" : {
                              "ts" : Timestamp(1685182483, 1),
                              "t" : NumberLong(1)
                      },
                      "lastAppliedWallTime" : ISODate("2023-05-27T10:14:43.714Z"),
                      "lastDurableWallTime" : ISODate("2023-05-27T10:14:43.714Z")
              },
              "lastStableRecoveryTimestamp" : Timestamp(1685182438, 1),
              "electionCandidateMetrics" : {
                      "lastElectionReason" : "electionTimeout",
                      "lastElectionDate" : ISODate("2023-05-27T10:12:03.578Z"),
                      "electionTerm" : NumberLong(1),
                      "lastCommittedOpTimeAtElection" : {
                              "ts" : Timestamp(0, 0),
                              "t" : NumberLong(-1)
                      },
                      "lastSeenOpTimeAtElection" : {
                              "ts" : Timestamp(1685182323, 1),
                              "t" : NumberLong(-1)
                      },
                      "numVotesNeeded" : 1,
                      "priorityAtElection" : 1,
                      "electionTimeoutMillis" : NumberLong(10000),
                      "newTermStartDate" : ISODate("2023-05-27T10:12:03.670Z"),
                      "wMajorityWriteAvailabilityDate" : ISODate("2023-05-27T10:12:03.712Z")
              },
              "members" : [
                      {
                              "_id" : 0,
                              "name" : "10.244.1.83:27017",
                              "health" : 1,
                              "state" : 1,
                              "stateStr" : "PRIMARY",
                              "uptime" : 173,
                              "optime" : {
                                      "ts" : Timestamp(1685182483, 1),
                                      "t" : NumberLong(1)
                              },
                              "optimeDate" : ISODate("2023-05-27T10:14:43Z"),
                              "lastAppliedWallTime" : ISODate("2023-05-27T10:14:43.714Z"),
                              "lastDurableWallTime" : ISODate("2023-05-27T10:14:43.714Z"),
                              "syncSourceHost" : "",
                              "syncSourceId" : -1,
                              "infoMessage" : "",
                              "electionTime" : Timestamp(1685182323, 2),
                              "electionDate" : ISODate("2023-05-27T10:12:03Z"),
                              "configVersion" : 5,
                              "configTerm" : 1,
                              "self" : true,
                              "lastHeartbeatMessage" : ""
                      },
                      {
                              "_id" : 1,
                              "name" : "mongodb-sts-1.mongodb-svc.kube-nosql-db:27017",
                              "health" : 1,
                              "state" : 2,
                              "stateStr" : "SECONDARY",
                              "uptime" : 53,
                              "optime" : {
                                      "ts" : Timestamp(1685182483, 1),
                                      "t" : NumberLong(1)
                              },
                              "optimeDurable" : {
                                      "ts" : Timestamp(1685182483, 1),
                                      "t" : NumberLong(1)
                              },
                              "optimeDate" : ISODate("2023-05-27T10:14:43Z"),
                              "optimeDurableDate" : ISODate("2023-05-27T10:14:43Z"),
                              "lastAppliedWallTime" : ISODate("2023-05-27T10:14:43.714Z"),
                              "lastDurableWallTime" : ISODate("2023-05-27T10:14:43.714Z"),
                              "lastHeartbeat" : ISODate("2023-05-27T10:14:51.822Z"),
                              "lastHeartbeatRecv" : ISODate("2023-05-27T10:14:51.853Z"),
                              "pingMs" : NumberLong(0),
                              "lastHeartbeatMessage" : "",
                              "syncSourceHost" : "10.244.1.83:27017",
                              "syncSourceId" : 0,
                              "infoMessage" : "",
                              "configVersion" : 5,
                              "configTerm" : 1
                      },
                      {
                              "_id" : 2,
                              "name" : "mongodb-sts-2.mongodb-svc.kube-nosql-db:27017",
                              "health" : 1,
                              "state" : 2,
                              "stateStr" : "SECONDARY",
                              "uptime" : 34,
                              "optime" : {
                                      "ts" : Timestamp(1685182483, 1),
                                      "t" : NumberLong(1)
                              },
                              "optimeDurable" : {
                                      "ts" : Timestamp(1685182483, 1),
                                      "t" : NumberLong(1)
                              },
                              "optimeDate" : ISODate("2023-05-27T10:14:43Z"),
                              "optimeDurableDate" : ISODate("2023-05-27T10:14:43Z"),
                              "lastAppliedWallTime" : ISODate("2023-05-27T10:14:43.714Z"),
                              "lastDurableWallTime" : ISODate("2023-05-27T10:14:43.714Z"),
                              "lastHeartbeat" : ISODate("2023-05-27T10:14:51.823Z"),
                              "lastHeartbeatRecv" : ISODate("2023-05-27T10:14:50.251Z"),
                              "pingMs" : NumberLong(0),
                              "lastHeartbeatMessage" : "",
                              "syncSourceHost" : "mongodb-sts-1.mongodb-svc.kube-nosql-db:27017",
                              "syncSourceId" : 1,
                              "infoMessage" : "",
                              "configVersion" : 5,
                              "configTerm" : 1
                      }
              ],
              "ok" : 1,
              "$clusterTime" : {
                      "clusterTime" : Timestamp(1685182483, 1),
                      "signature" : {
                              "hash" : BinData(0,"AAAAAAAAAAAAAAAAAAAAAAAAAAA="),
                              "keyId" : NumberLong(0)
                      }
              },
              "operationTime" : Timestamp(1685182483, 1)
      }
Note: The members section of the status output shows three replicas. The pod mongodb-sts-0 is listed as the __ Primary__ replica, while the other two pods, mongodb-sts-1 and mongodb-sts-2, are listed as the Secondary replicas.
The ReplicaSet deployment of MongoDB is set up and ready to operate.
Quit the replica set member with the following command:
> exit
Now let's create the admin account.
Connect to the first (primary) replica set member shell with the following command:
> kubectl -n kube-nosql-db exec -it mongodb-sts-0 -- mongo
Switch to admin database with the following command:
> use admin
Create admin user with the following command:
> db.createUser({ user:'admin', pwd:'mongo12345', roles:[ { role:'userAdminAnyDatabase', db: 'admin'}]})
You should see the following output:
Successfully added user: {
        "user" : "admin",
        "roles" : [
                {
                        "role" : "userAdminAnyDatabase",
                        "db" : "admin"
                }
        ]
}
It means admin account has been created successfully. Quit the replica set member with the following command:
> exit
At this point, your MongoDB cluster is ready for work. Test it as follows:
Connect to the first (primary) replica set member shell with the following command:
> kubectl -n kube-nosql-db exec -it mongodb-sts-0 -- mongo
Display all databases with the following command:
> show dbs
You should see the following output:
      admin    80.00 KiB
      config  176.00 KiB
      local   404.00 KiB
Switch to the test database (if not) and add test entries with the following commands:
     > use test
     > db.games.insertOne({name: "RPS game", language: "Java" })
     > db.games.insertOne({name: "Tic-Tac-Toe game" })
Display all data from the test database with the following commands:
> db.games.find()
You should see the following output:
      { "_id" : ObjectId("6471d9141175a02c9a9c27a0"), "name" : "RPS game", "language" : "Java" }
      { "_id" : ObjectId("6471d9211175a02c9a9c27a1"), "name" : "Tic-Tac-Toe game" }
Quit the primary replica set member with the following command:
> exit
Connect to the second (secondary) replica set member shell with the following command:
> kubectl -n kube-nosql-db exec -it mongodb-sts-1 -- mongo
Set a read preference to the secondary replica set member with the following command:
> rs.secondaryOk()
Display all databases with the following command:
> show dbs
You should see the following output:
      admin    80.00 KiB
      config  176.00 KiB
      local   404.00 KiB
      test     72.00 KiB
Display all data from the test database with the following commands:
> db.games.find()
You should see the following output:
      { "_id" : ObjectId("6471d9141175a02c9a9c27a0"), "name" : "RPS game", "language" : "Java" }
      { "_id" : ObjectId("6471d9211175a02c9a9c27a1"), "name" : "Tic-Tac-Toe game" }
Repeat the same steps for the third (secondary) replica set member by changing the name of the pod to mongodb-sts-2.
Mongo Express is an open source, basic web-based MongoDB admin interface.
To create a Simple Single Service Ingress for the Mongo Express application, run:
> kubectl apply -f ./k8s/ingress/mongodb-ingress.yml
Note: A Mongo Express application Simple Single Service Ingress configuration exposes only one service to external users.

Make sure the Mongo Express application ingress has been created:
> kubectl get ingress -n kube-nosql-db
You should see the following output:
      NAME                    CLASS   HOSTS                    ADDRESS        PORTS   AGE
      mongodb-ingress         nginx   mongodb.internal         192.168.49.2   80      40h
Note the ip address (192.168.49.2) displayed in the output, as you will need this in the next step.
Add a custom entry to the etc/hosts file using the nano text editor:
> sudo nano /etc/hosts
You should add the following ip address (copied in the previous step) and custom domain to the hosts file:
192.168.49.2 mongodb.internal
You may check the custom domain name with ping command:
> ping mongodb.internal
You should see the following output:
      64 bytes from mongodb.internal (192.168.49.2): icmp_seq=1 ttl=64 time=0.072 ms
      64 bytes from mongodb.internal (192.168.49.2): icmp_seq=2 ttl=64 time=0.094 ms
      64 bytes from mongodb.internal (192.168.49.2): icmp_seq=3 ttl=64 time=0.042 ms
Access the Mongo Express application from any browser by typing:
> mongodb.internal
To deploy Mongo Express to Kubernetes, first run:
> kubectl apply -f ./k8s/services/mongodb-express-svc.yml
It deploys a ClusterIP service for Mongo Express pods.
Then run:
> kubectl apply -f ./k8s/deployment/mongodb-express-deployment.yml
Redis is an open source, in-memory data structure store used as a distributed cache in the RPS application. It is used to store data in a key-value format, allowing for fast access and retrieval of data. Redis is a popular choice for distributed caching due to its scalability, performance, and flexibility.
Redis is used to implement the following patterns:
- Cache-Aside pattern.
To create a kube-cache namespace on the k8s cluster, run:
> kubectl apply -f ./k8s/namespaces/kube-cache-ns.yml
To check the status, run:
> kubectl get namespaces --show-labels
You should see the following output:
      NAME                   STATUS   AGE     LABELS
      default                Active   2d13h   kubernetes.io/metadata.name=default
      ingress-nginx          Active   2d13h   app.kubernetes.io/instance=ingress-nginx,app.kubernetes.io/name=ingress-nginx,kubernetes.io/metadata.name=ingress-nginx
      kube-cache             Active   25s     kubernetes.io/metadata.name=kube-cache,name=kube-cache
      kube-db                Active   99m     kubernetes.io/metadata.name=kube-db,name=kube-db
      kube-elk               Active   2d12h   kubernetes.io/metadata.name=kube-elk,name=kube-elk
      kube-node-lease        Active   2d13h   kubernetes.io/metadata.name=kube-node-lease
      kube-public            Active   2d13h   kubernetes.io/metadata.name=kube-public
      kube-system            Active   2d13h   kubernetes.io/metadata.name=kube-system
      kubernetes-dashboard   Active   2d13h   addonmanager.kubernetes.io/mode=Reconcile,kubernetes.io/metadata.name=kubernetes-dashboard,kubernetes.io/minikube-addons=dashboard
To deploy Redis cluster to Kubernetes, first run:
> kubectl apply -f ./k8s/rbacs/redis-rbac.yml
Then run:
> kubectl apply -f ./k8s/configmaps/redis-configmap.yml
Then deploy a headless service for Redis pods using the following command:
> kubectl apply -f ./k8s/services/redis-svc.yml
Note: You cannot directly access the application running in the pod. If you want to access the application, you need a Service object in the Kubernetes cluster.
Headless service means that only internal pods can communicate with each other. They are not exposed to external requests outside the Kubernetes cluster. Headless services expose the individual pod IPs instead of the service IP and should be used when client applications or pods want to communicate with specific (not randomly selected) pod (stateful application scenarios).
To get the list of running services under the Redis namespace, run:
> kubectl get service -n kube-cache
You should see the following output:
      NAME        TYPE        CLUSTER-IP   EXTERNAL-IP   PORT(S)    AGE
      redis-svc   ClusterIP   None         <none>        6379/TCP   4h11m
Then run:
> kubectl apply -f ./k8s/secrets/redis-secret.yml
Now the secrets can be referenced in our statefulset. And then run:
> kubectl apply -f ./k8s/sets/redis-statefulset.yml
To monitor the deployment status, run:
> kubectl rollout status sts/redis-sts -n kube-cache
You should see the following output:
statefulset rolling update complete 3 pods at revision redis-sts-85577d848c...
To check the pod status, run:
> kubectl get pods -n kube-cache
You should see the following output:
      NAME          READY   STATUS    RESTARTS   AGE
      redis-sts-0   1/1     Running   0          5m40s
      redis-sts-1   1/1     Running   0          5m37s
      redis-sts-2   1/1     Running   0          5m34s
At this point, your Redis cluster is ready for work. Test it as follows:
Connect to the first (master) replica set member shell with the following command:
> kubectl -n kube-cache exec -it redis-sts-0 -- sh
Then connect to Redis the Redis CLI:
# redis-cli
You should see the following output:
127.0.0.1:6379>
Authenticate to Redis with following command:
127.0.0.1:6379> auth 12345
Check the replica member replication information with the following command:
127.0.0.1:6379> info replication
You should see the following output:
      # Replication
      role:master
      connected_slaves:2
      slave0:ip=10.244.1.205,port=6379,state=online,offset=952,lag=1
      slave1:ip=10.244.1.206,port=6379,state=online,offset=952,lag=1
      master_replid:e7add4a40b5434360c75163ab01d8871928c5f03
      master_replid2:0000000000000000000000000000000000000000
      master_repl_offset:952
      second_repl_offset:-1
      repl_backlog_active:1
      repl_backlog_size:1048576
      repl_backlog_first_byte_offset:1
      repl_backlog_histlen:952
Check the roles of the replica member with the following command:
127.0.0.1:6379> role
You should see the following output:
      1) "master"
      2) (integer) 728
      3) 1) 1) "10.244.1.205"
            2) "6379"
            3) "728"
         2) 1) "10.244.1.206"
            2) "6379"
            3) "728"
Create some key-value pair data using the following command:
     127.0.0.1:6379> set game1 RPS
     OK
     127.0.0.1:6379> set game2 Tic-Tac-Toe
     OK
Now get the key-value pair list with the following command:
127.0.0.1:6379> keys *
You should see the following output:
      1) "game1"
      2) "game2"
Connect to the second (slave) replica set member shell with the following command:
> kubectl -n kube-cache exec -it redis-sts-1 -- sh
Then connect to Redis the Redis CLI:
# redis-cli
And type the following command:
127.0.0.1:6379> keys *
You should see the following output:
      1) "game1"
      2) "game2"
Repeat the same steps for the third (slave) replica set member by changing the name of the pod to redis-sts-2.
Apache Kafka is an open-source, event streaming platform that is distributed, scalable, high-throughput, low-latency, and has a very large ecosystem.
Apache Kafka is used to implement the following patterns:
Local Machine
5.1 Adding custom entries to the etc/host file for the Apache Zookeeper and Kafka applications on local machine
Window 10
Open the _C:\windows\system32\drivers\etc\hosts_ file in any text editor and add the following entries and save the file:
> 127.0.0.1 zk.internal kafka.internal
Linux Ubuntu 20.04.6 LTS
Open the _/etc/hosts_ file using the following command:
> sudo nano /etc/hosts
Add the following entries and save the file:
> 127.0.0.1 zk.internal kafka.internal
Window 10
-
Download and extract apache-zookeeper-3.8.0-bin.tar.gz archive file from the Apache Zookeeper website.
-
Open the conf folder and rename the zoo_sample.cfg file to the zoo.cfg.
-
Open the zoo.cfg file and make changes below:
| property | initial value | new value |
|---|---|---|
| dataDir | /tmp/zookeeper | D:/data/zookeeper |
| initLimit | 10 | 5 |
| syncLimit | 5 | 2 |
- Then add the following line to the zoo.cfg file and save changes.
server.1=zk.internal:2888:3888
- Open the command line tool and execute the following command to start the apache-zookeeper-3.8.0 server:
> bin\zkServer.cmd
Note the binding port displayed in the output, it should be 2181 by default.
2023-07-01 13:37:26,687 [myid:] - INFO [main:o.a.z.s.NIOServerCnxnFactory@660] - binding to port 0.0.0.0/0.0.0.0:2181
Linux Ubuntu 20.04.6 LTS
* Ensure your system is updated:
> sudo apt update && sudo apt upgrade
- Download and extract apache-zookeeper-3.8.0-bin.tar.gz archive file from the Apache Zookeeper website.
      > sudo wget https://downloads.apache.org/zookeeper/zookeeper-3.8.0/apache-zookeeper-3.8.0-bin.tar.gz
      > sudo tar -xvzf apache-zookeeper-3.8.0-bin.tar.gz
- Move the extracted files to the /opt/zookeeper directory with the following command:
> sudo mv apache-zookeeper-3.8.0-bin /opt/zookeeper
- Then open the /etc/environment file using the following command:
> sudo nano /etc/environment
- At the end of the file, add the following line and save the changes.
ZOOKEEPER_HOME="/opt/zookeeper"
- Then reload this file to apply the changes to your current session with the following command:
> source /etc/environment
- Finally, verify that the ZOOKEEPER_HOME environment variable is set:
> echo $ZOOKEEPER_HOME
You should see the following output:
/opt/zookeeper
- Create a separate user account (service account) for the zookeeper service using the following commands:
      > sudo useradd zookeeper -m
      > sudo usermod --shell /bin/bash zookeeper
- Add the user to the sudo group for it to have Administrative Privileges using the following command:
> sudo usermod -aG sudo zookeeper
- Hide the account from the login screen:
> sudo /var/lib/AccountsService/users/zookeeper
and add the following lines to the file:
      [User]
      SystemAccount=true
- Give the zookeeper user ownership of the zookeeper files by executing the following command:
> sudo chown -R zookeeper:zookeeper $ZOOKEEPER_HOME
- Create a new ZooKeeper directory to store the data on a local machine and give the zookeeper user ownership to that directory by executing the following commands:
      > sudo mkdir -p /data/zookeeper
      > sudo chown -R zookeeper:zookeeper /data/zookeeper
- Rename the zoo_sample.cfg file to the zoo.cfg with the following command:
> sudo mv $ZOOKEEPER_HOME/conf/zoo_sample.cfg $ZOOKEEPER_HOME/conf/zoo.cfg
- Open the zoo.cfg file with the following command:
> sudo nano $ZOOKEEPER_HOME/conf/zoo.cfg
- And make changes below:
| property | initial value | new value |
|---|---|---|
| dataDir | /tmp/zookeeper | /data/zookeeper |
| initLimit | 10 | 5 |
| syncLimit | 5 | 2 |
- Then add the following line to the zoo.cfg file and save changes.
server.1=zk.internal:2888:3888
- Start the apache-zookeeper-3.8.0 server by executing the following command:
> sudo $ZOOKEEPER_HOME/bin/zkServer.sh start
You should see the following output:
      /usr/bin/java
      ZooKeeper JMX enabled by default
      Using config: /opt/zookeeper/bin/../conf/zoo.cfg
      Starting zookeeper ... STARTED
Windows 10
-
Download and extract kafka_2.13-2.7.0.tgz archive file from the Apache Kafka website.
-
Open the config folder and open the server.properties file. Make the changes below and save the file.
| property | initial value | new value |
|---|---|---|
| log.dirs | /tmp/kafka-logs | D:/data/kafka |
| zookeeper.connect | localhost:2181 | zk.internal:2181 |
- Then open the config/producer.properties file, make the changes below and save the file.
| property | initial value | new value |
|---|---|---|
| bootstrap.servers | localhost:9092 | kafka.internal:9092 |
- Then open the config/consumer.properties file, make the changes below and save the file.
| property | initial value | new value |
|---|---|---|
| bootstrap.servers | localhost:9092 | kafka.internal:9092 |
- Open the command line tool and execute the following command to start the apache-kafka-2.7.0 server:
> bin\windows\kafka-server-start.bat config\server.properties
Linux Ubuntu 20.04.6 LTS
* Ensure your system is updated:
> sudo apt update && sudo apt upgrade
- Download and extract kafka_2.13-2.7.0.tgz archive file from the Apache Kafka website.
      > sudo wget https://archive.apache.org/dist/kafka/2.7.0/kafka_2.13-2.7.0.tgz
      > sudo tar -xvzf kafka_2.13-2.7.0.tgz
- Move the extracted files to the /opt/kafka directory with the following command:
> sudo mv kafka_2.13-2.7.0 /opt/kafka
- Then open the /etc/environment file using the following command:
> sudo nano /etc/environment
- At the end of the file, add the following line and save the changes.
KAFKA_HOME="/opt/kafka"
- Then reload this file to apply the changes to your current session with the following command:
> source /etc/environment
- Finally, verify that the KAFKA_HOME environment variable is set:
> echo $KAFKA_HOME
You should see the following output:
/opt/kafka
- Create a separate user account (service account) for the kafka service using the following commands:
      > sudo useradd kafka -m
      > sudo usermod --shell /bin/bash kafka
- Add the user to the sudo group for it to have Administrative Privileges using the following command:
> sudo usermod -aG sudo kafka
- Hide the account from the login screen:
> sudo /var/lib/AccountsService/users/kafka
and add the following lines to the file:
      [User]
      SystemAccount=true
- Give the kafka user ownership of the kafka files by executing the following command:
> sudo chown -R kafka:kafka $KAFKA_HOME
- Create a new Kafka directory to store the data on a local machine and give the kafka user ownership to that directory by executing the following commands:
      > sudo mkdir -p /data/kafka
      > sudo chown -R kafka:kafka /data/kafka
- Open the config folder and open the server.properties file with the following command:
> sudo nano $KAFKA_HOME/config/server.properties
- Make changes below and save the file.
| property | initial value | new value |
|---|---|---|
| log.dirs | /tmp/kafka-logs | /data/kafka |
| zookeeper.connect | localhost:2181 | zk.internal:2181 |
- Then open the config/producer.properties file with the following command:
> sudo nano $KAFKA_HOME/config/producer.properties
- Make the changes below and save the file.
| property | initial value | new value |
|---|---|---|
| bootstrap.servers | localhost:9092 | kafka.internal:9092 |
- Then open the config/consumer.properties file with the following command:
> sudo nano $KAFKA_HOME/config/consumer.properties
- Finally, open the config/consumer.properties file, make the changes below and save the file.
| property | initial value | new value |
|---|---|---|
| bootstrap.servers | localhost:9092 | kafka.internal:9092 |
- Start the Apache Kafka server by executing the following command:
> sudo $KAFKA_HOME/bin/kafka-server-start.sh $KAFKA_HOME/config/server.properties
Docker Compose
- Navigate (if it's not already in) to the root directory of the RPS Game project on your computer and run the Docker Compose command below to deploy Kafka cluster on Docker Compose in the background:
> docker compose -f docker-compose-kafka.yml up -d
You should see the following output:
    [+] Running 6/6
     ✔ Container rps-app-zk-3-1     Started     0.0s
     ✔ Container rps-app-zk-1-1     Started     0.0s
     ✔ Container rps-app-zk-2-1     Started     0.0s
     ✔ Container rps-app-kafka-3-1  Started     0.0s
     ✔ Container rps-app-kafka-1-1  Started     0.0s
     ✔ Container rps-app-kafka-2-1  Started     0.0s
- Verify that Zookeeper and Kafka containers are up and running by executing the following command:
> docker compose -f docker-compose-kafka.yml ps
You should see the following output:
    NAME                             IMAGE                                     COMMAND                  SERVICE             CREATED             STATUS              PORTS
    rps-app-kafka-1-1                bitnami/kafka:2.7.0                       "/opt/bitnami/script…"   kafka-1             4 minutes ago       Up 3 minutes        9092/tcp, 0.0.0.0:19093->9093/tcp
    rps-app-kafka-2-1                bitnami/kafka:2.7.0                       "/opt/bitnami/script…"   kafka-2             4 minutes ago       Up 3 minutes        9092/tcp, 0.0.0.0:19094->9094/tcp
    rps-app-kafka-3-1                bitnami/kafka:2.7.0                       "/opt/bitnami/script…"   kafka-3             4 minutes ago       Up 3 minutes        9092/tcp, 0.0.0.0:19095->9095/tcp
    rps-app-zk-1-1                   bitnami/zookeeper:3.8.0                   "/opt/bitnami/script…"   zk-1                4 minutes ago       Up 4 minutes        2888/tcp, 3888/tcp, 8080/tcp, 0.0.0.0:12181->2181/tcp
    rps-app-zk-2-1                   bitnami/zookeeper:3.8.0                   "/opt/bitnami/script…"   zk-2                4 minutes ago       Up 4 minutes        2888/tcp, 3888/tcp, 8080/tcp, 0.0.0.0:12182->2181/tcp
    rps-app-zk-3-1                   bitnami/zookeeper:3.8.0                   "/opt/bitnami/script…"   zk-3                4 minutes ago       Up 4 minutes        2888/tcp, 3888/tcp, 8080/tcp, 0.0.0.0:12183->2181/tcp
It means that Zookeeper and Kafka containers are up and running.
- When we don't need Kafka cluster anymore, we can take down containers and delete their corresponding volumes (-v) using the down command below:
> docker compose -f docker-compose-kafka.yml down -v
Kubernetes
To create a kube-kafka namespace on the k8s cluster, run:
> kubectl apply -f ./k8s/namespaces/kube-kafka-ns.yml
To check the status, run:
> kubectl get namespaces --show-labels
You should see the following output:
      NAME                   STATUS   AGE     LABELS
      default                Active   10d     kubernetes.io/metadata.name=default
      ingress-nginx          Active   10d     app.kubernetes.io/instance=ingress-nginx,app.kubernetes.io/name=ingress-nginx,kubernetes.io/metadata.name=ingress-nginx
      kube-cache             Active   3d16h   kubernetes.io/metadata.name=kube-cache,name=kube-cache
      kube-db                Active   6d19h   kubernetes.io/metadata.name=kube-db,name=kube-db
      kube-elk               Active   18h     kubernetes.io/metadata.name=kube-elk,name=kube-elk
      kube-kafka             Active   23s     kubernetes.io/metadata.name=kube-kafka,name=kube-kafka
      kube-monitoring        Active   29m     kubernetes.io/metadata.name=kube-monitoring,name=kube-monitoring
      kube-node-lease        Active   10d     kubernetes.io/metadata.name=kube-node-lease
      kube-nosql-db          Active   26h     kubernetes.io/metadata.name=kube-nosql-db,name=kube-nosql-db
      kube-public            Active   10d     kubernetes.io/metadata.name=kube-public
      kube-system            Active   10d     kubernetes.io/metadata.name=kube-system
      kubernetes-dashboard   Active   10d     addonmanager.kubernetes.io/mode=Reconcile,kubernetes.io/metadata.name=kubernetes-dashboard,kubernetes.io/minikube-addons=dashboard
The first step is to deploy Apache Zookeeper on your K8S cluster using Zookeeper Bitnami's Helm chart.
The Apache Zookeeper deployment will use this Apache Zookeeper deployment for coordination and management.
Apache Zookeeper is used to implement the following patterns:
First, add the Bitnami charts repository to Helm:
> helm repo add bitnami https://charts.bitnami.com/bitnami
You should see the following output:
"bitnami" has been added to your repositories
Then execute the following command to deploy an Apache Zookeeper cluster with 3 nodes:
> helm install zookeeper bitnami/zookeeper --set image.tag=3.8.0-debian-10-r78 --set replicaCount=3 --set auth.enabled=false --set allowAnonymousLogin=true -n kube-kafka
Wait for some time until the chart is deployed. You should see the following output:
      NAME: zookeeper
      LAST DEPLOYED: Wed May 31 19:50:42 2023
      NAMESPACE: kube-kafka
      STATUS: deployed
      REVISION: 1
      TEST SUITE: None
      NOTES:
      CHART NAME: zookeeper
      CHART VERSION: 11.4.2
      APP VERSION: 3.8.1

      ** Please be patient while the chart is being deployed **

      ZooKeeper can be accessed via port 2181 on the following DNS name from within your cluster:

          zookeeper.kube-kafka.svc.cluster.local

      To connect to your ZooKeeper server run the following commands:

          export POD_NAME=$(kubectl get pods --namespace kube-kafka -l "app.kubernetes.io/name=zookeeper,app.kubernetes.io/instance=zookeeper,app.kubernetes.io/component=zookeeper" -o jsonpath="{.items[0].metadata.name}")
          kubectl exec -it $POD_NAME -- zkCli.sh

      To connect to your ZooKeeper server from outside the cluster execute the following commands:

          kubectl port-forward --namespace kube-kafka svc/zookeeper 2181:2181 &
          zkCli.sh 127.0.0.1:2181
Note the service name displayed in the output, as you will need this in subsequent steps.
zookeeper.kube-kafka.svc.cluster.local
Make sure that the Zookeeper cluster is up and running with the following command:
> kubectl get pods -n kube-kafka -o wide
You should see the following output:
      NAME              READY   STATUS    RESTARTS   AGE   IP            NODE       NOMINATED NODE   READINESS GATES
      zookeeper-0       1/1     Running   0          81s   10.244.0.22   minikube   <none>           <none>
      zookeeper-1       1/1     Running   0          81s   10.244.0.24   minikube   <none>           <none>
      zookeeper-2       1/1     Running   0          81s   10.244.0.23   minikube   <none>           <none>
The next step is to deploy Apache Zookeeper, again with Kafka Bitnami's Helm chart. In this case, we will provide the name of the Apache Zookeeper service as a parameter to the Helm chart.
> helm install kafka bitnami/kafka --set image.tag=2.7.0-debian-10-r100 --set zookeeper.enabled=false --set kraft.enabled=false --set replicaCount=3 --set externalZookeeper.servers=zookeeper.kube-kafka -n kube-kafka
This command will deploy a three-node Apache Zookeeper cluster and configure the nodes to connect to the Apache Zookeeper service. Wait for some time until the chart is deployed. You should see the following output:
      NAME: kafka
      LAST DEPLOYED: Wed May 31 19:53:02 2023
      NAMESPACE: kube-kafka
      STATUS: deployed
      REVISION: 1
      TEST SUITE: None
      NOTES:
      CHART NAME: kafka
      CHART VERSION: 22.1.3
      APP VERSION: 3.4.0

      ** Please be patient while the chart is being deployed **

      Kafka can be accessed by consumers via port 9092 on the following DNS name from within your cluster:

          kafka.kube-kafka.svc.cluster.local

      Each Kafka broker can be accessed by producers via port 9092 on the following DNS name(s) from within your cluster:

          kafka-0.kafka-headless.kube-kafka.svc.cluster.local:9092
          kafka-1.kafka-headless.kube-kafka.svc.cluster.local:9092
          kafka-2.kafka-headless.kube-kafka.svc.cluster.local:9092

      To create a pod that you can use as a Kafka client run the following commands:

          kubectl run kafka-client --restart='Never' --image docker.io/bitnami/kafka:2.7.0-debian-10-r100 --namespace kube-kafka --command -- sleep infinity
          kubectl exec --tty -i kafka-client --namespace kube-kafka -- bash

          PRODUCER:
              kafka-console-producer.sh \
                  --broker-list kafka-0.kafka-headless.kube-kafka.svc.cluster.local:9092,kafka-1.kafka-headless.kube-kafka.svc.cluster.local:9092,kafka-2.kafka-headless.kube-kafka.svc.cluster.local:9092 \
                  --topic test

          CONSUMER:
              kafka-console-consumer.sh \
                  --bootstrap-server kafka.kube-kafka.svc.cluster.local:9092 \
                  --topic test \
                  --from-beginning
Note the service name displayed in the output, as you will need this in the next step:
kafka.kube-kafka.svc.cluster.local
Also note the Kafka broker access details, as you will need this for microservice Kafka configurations (ConfigMap of each microservice):
      kafka-0.kafka-sts-headless.kube-kafka.svc.cluster.local:9092
      kafka-1.kafka-sts-headless.kube-kafka.svc.cluster.local:9092
      kafka-2.kafka-sts-headless.kube-kafka.svc.cluster.local:9092
Make sure that the Kafka cluster is up and running with the following command:
> kubectl get pods -n kube-kafka -o wide
You should see the following output:
      NAME          READY   STATUS    RESTARTS   AGE     IP            NODE       NOMINATED NODE   READINESS GATES
      kafka-0       1/1     Running   0          70s     10.244.0.36   minikube   <none>           <none>
      kafka-1       1/1     Running   0          70s     10.244.0.35   minikube   <none>           <none>
      kafka-2       1/1     Running   0          70s     10.244.0.34   minikube   <none>           <none>
      zookeeper-0   1/1     Running   0          3m31s   10.244.0.32   minikube   <none>           <none>
      zookeeper-1   1/1     Running   0          3m31s   10.244.0.31   minikube   <none>           <none>
      zookeeper-2   1/1     Running   0          3m31s   10.244.0.33   minikube   <none>           <none>
Check the kafka logs with the following command:
> kubectl logs kafka-0 -n kube-kafka -f
To confirm that the Apache Zookeeper and Apache Zookeeper deployments are connected, check the logs for any of the Apache Kafka pods and ensure that you see lines similar to the ones shown below, which confirm the connection:
      [2023-05-31 19:53:10,838] INFO Socket connection established, initiating session, client: /10.244.0.36:47092, server: zookeeper.kube-kafka/10.110.153.100:2181 (org.apache.zookeeper.ClientCnxn)
      [2023-05-31 19:53:10,849] INFO Session establishment complete on server zookeeper.kube-kafka/10.110.153.100:2181, sessionid = 0x30000c058cd0001, negotiated timeout = 18000 (org.apache.zookeeper.ClientCnxn)
      [2023-05-31 19:53:10,854] INFO [ZooKeeperClient Kafka server] Connected. (kafka.zookeeper.ZooKeeperClient)
      [2023-05-31 19:53:10,978] INFO [feature-zk-node-event-process-thread]: Starting (kafka.server.FinalizedFeatureChangeListener$ChangeNotificationProcessorThread)
      [2023-05-31 19:53:11,014] INFO Feature ZK node at path: /feature does not exist (kafka.server.FinalizedFeatureChangeListener)
      [2023-05-31 19:53:11,020] INFO Cleared cache (kafka.server.FinalizedFeatureCache)
      [2023-05-31 19:53:11,246] INFO Cluster ID = mq2vGCG7RSOJX0vsqWFS9A (kafka.server.KafkaServer)
      [2023-05-31 19:53:11,265] WARN No meta.properties file under dir /bitnami/kafka/data/meta.properties (kafka.server.BrokerMetadataCheckpoint)
At this point, your Apache Zookeeper cluster is ready for work. Test it as follows:
Create a topic named mytopic using the commands below. Replace the ZOOKEEPER-SERVICE-NAME placeholder with the Apache Zookeeper service name obtained earlier:
      > kubectl --namespace kube-kafka exec -it <name of kafka pod> -- kafka-topics.sh --create --zookeeper ZOOKEEPER-SERVICE-NAME:2181 --replication-factor 1 --partitions 1 --topic mytopic
      for example:
      > kubectl --namespace kube-kafka exec -it kafka-0 -- kafka-topics.sh --create --zookeeper zookeeper.kube-kafka.svc.cluster.local:2181 --replication-factor 1 --partitions 1 --topic mytopic
Start a Kafka message consumer. This consumer will connect to the cluster and retrieve and display messages as they are published to the mytopic topic. Replace the KAFKA-SERVICE-NAME placeholder with the Apache Zookeeper service name obtained earlier:
      > kubectl --namespace kube-kafka exec -it <name of kafka pod> -- kafka-console-consumer.sh --bootstrap-server KAFKA-SERVICE-NAME:9092 --topic mytopic --consumer.config /opt/bitnami/kafka/config/consumer.properties
      for example:
      > kubectl --namespace kube-kafka exec -it kafka-0 -- kafka-console-consumer.sh --bootstrap-server kafka.kube-kafka.svc.cluster.local:9092 --topic mytopic --consumer.config /opt/bitnami/kafka/config/consumer.properties
Using a different console, start a Kafka message producer and produce some messages by running the command below and then entering some messages, each on a separate line. Replace the KAFKA-SERVICE-NAME placeholder with the Apache Zookeeper service name obtained earlier:
      > kubectl --namespace kube-kafka exec -it <name of kafka pod> -- kafka-console-producer.sh --broker-list KAFKA-SERVICE-NAME:9092 --topic mytopic --producer.config /opt/bitnami/kafka/config/producer.properties
      for example:
      > kubectl --namespace kube-kafka exec -it <name of kafka pod> -- kafka-console-producer.sh --broker-list kafka.kube-kafka.svc.cluster.local:9092 --topic mytopic --producer.config /opt/bitnami/kafka/config/producer.properties
The messages should appear in the Kafka message consumer.
Deploy a Scalable Apache Kafka/Zookeeper Cluster on Kubernetes with Bitnami and Helm
Docker Compose
- Navigate (if it's not already in) to the root directory of the RPS Game project on your computer and run the Docker Compose command below to deploy the RPS Game Command microservice on Docker Compose in the background:
> docker compose -f docker-compose-api-rps-cmd.yml up -d
You should see the following output:
    [+] Running 1/1
     ✔ Container rps-app-rps-cmd-service-1             Started       1.7s
- Verify that RPS Game Command microservice container is up and running by executing the following command:
> docker compose -f docker-compose-api-rps-cmd.yml ps
You should see the following output:
    NAME                             IMAGE                                     COMMAND                  SERVICE             CREATED             STATUS              PORTS
    rps-app-rps-cmd-service-1        rps-app-rps-cmd-service                   "java -Dspring.profi…"   rps-cmd-service     2 minutes ago       Up 2 minutes        8080/tcp, 0.0.0.0:18081->80/tcp, 0.0.0.0:16566->6565/tcp
It means that RPS Game Command microservice is up and running.
- When we don't need RPS Game Command microservice anymore, we can take down container and delete their corresponding volumes (-v) using the down command below:
> docker compose -f docker-compose-api-rps-cmd.yml down -v
Kubernetes
See: [Rock Paper Scissors game command microservice](https://github.com/hokushin118/rps-microservices/blob/master/microservices/rps-cmd-service/README.md) for details.
Docker Compose
- Navigate (if it's not already in) to the root directory of the RPS Game project on your computer and run the Docker Compose command below to deploy the RPS Game Query microservice on Docker Compose in the background:
> docker compose -f docker-compose-api-rps-qry.yml up -d
You should see the following output:
    [+] Running 1/1
     ✔ Container rps-app-rps-qry-service-1             Started       2.3s
- Verify that RPS Game Query microservice container is up and running by executing the following command:
> docker compose -f docker-compose-api-rps-qry.yml ps
You should see the following output:
    NAME                             IMAGE                                     COMMAND                  SERVICE             CREATED             STATUS              PORTS
    rps-app-rps-qry-service-1        rps-app-rps-qry-service                   "java -Dspring.profi…"   rps-qry-service     2 minutes ago       Up 2 minutes        8080/tcp, 0.0.0.0:18082->80/tcp, 0.0.0.0:16567->6565/tcp
It means that RPS Game Query microservice is up and running.
- When we don't need RPS Game Query microservice anymore, we can take down container and delete their corresponding volumes (-v) using the down command below:
> docker compose -f docker-compose-api-rps-qry.yml down -v
Kubernetes
See: [Rock Paper Scissors game query microservice](https://github.com/hokushin118/rps-microservices/blob/master/microservices/rps-qry-service/README.md) for details.
Docker Compose
- Navigate (if it's not already in) to the root directory of the RPS Game project on your computer and run the Docker Compose command below to deploy the Score Command microservice on Docker Compose in the background:
> docker compose -f docker-compose-api-score-cmd.yml up -d
You should see the following output:
    [+] Running 1/1
     ✔ Container rps-app-score-cmd-service-1           Started       2.0s
- Verify that Score Command microservice container is up and running by executing the following command:
> docker compose -f docker-compose-api-score-cmd.yml ps
You should see the following output:
    NAME                             IMAGE                                     COMMAND                  SERVICE             CREATED             STATUS              PORTS
    rps-app-score-cmd-service-1      rps-app-score-cmd-service                 "java -Dspring.profi…"   score-cmd-service   2 minutes ago       Up 2 minutes        8080/tcp, 0.0.0.0:18083->80/tcp, 0.0.0.0:16568->6565/tcp
It means that Score Command microservice is up and running.
- When we don't need Score Command microservice anymore, we can take down container and delete their corresponding volumes (-v) using the down command below:
> docker compose -f docker-compose-api-score-cmd.yml down -v
Kubernetes
See: [Score command microservice](https://github.com/hokushin118/rps-microservices/blob/master/microservices/score-cmd-service/README.md) for details.
Docker Compose
- Navigate (if it's not already in) to the root directory of the RPS Game project on your computer and run the Docker Compose command below to deploy the Score Query microservice on Docker Compose in the background:
> docker compose -f docker-compose-api-score-qry.yml up -d
You should see the following output:
    [+] Running 1/1
     ✔ Container rps-app-score-qry-service-1           Started       1.9s
- Verify that Score Query microservice container is up and running by executing the following command:
> docker compose -f docker-compose-api-score-qry.yml ps
You should see the following output:
    NAME                             IMAGE                                     COMMAND                  SERVICE             CREATED             STATUS              PORTS
    rps-app-score-qry-service-1      rps-app-score-qry-service                 "java -Dspring.profi…"   score-qry-service   2 minutes ago       Up 2 minutes        8080/tcp, 0.0.0.0:18084->80/tcp, 0.0.0.0:16569->6565/tcp
It means that Score Query microservice is up and running.
- When we don't need Score Query microservice anymore, we can take down container and delete their corresponding volumes (-v) using the down command below:
> docker compose -f docker-compose-api-score-qry.yml down -v
Kubernetes
See: [Score query microservice](https://github.com/hokushin118/rps-microservices/blob/master/microservices/score-qry-service/README.md) for details.
The Nginx API gateway is the entry point for clients. Instead of calling services directly, clients call the RPS Game application API gateway, which forwards the call to the appropriate services on the back end.
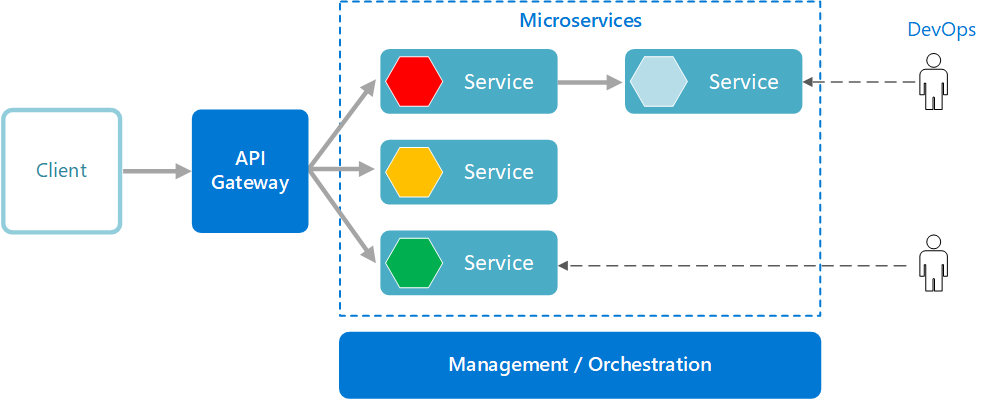
Advantages of using an API gateway include:
- It decouples clients from services. Services can be versioned or refactored without needing to update all of the clients.
- Services can use messaging protocols that are not web friendly, such as AMQP.
- The API gateway can perform other cross-cutting functions such as authentication, logging, SSL termination, and load balancing.
- Out-of-the-box policies, like for throttling, caching, transformation, or validation.
The Api gateway is used to implement the following patterns:
Docker Compose
- Navigate (if it's not already in) to the root directory of the RPS Game project on your computer and run the Docker Compose command below to deploy Nginx as api gateway for REST and gRPC microservices on Docker Compose in the background:
> docker compose -f docker-compose-api-gw.yml up -d
You should see the following output:
    [+] Running 1/1
     ✔ Container rps-app-nginx-1        Started     0.0s
> docker compose -f docker-compose-api-gw.yml ps
You should see the following output:
  NAME                             IMAGE                                     COMMAND                  SERVICE             CREATED              STATUS                          PORTS
  rps-app-nginx-1                            rps-app-nginx                             "nginx -g 'daemon of…"   nginx               About a minute ago   Up About a minute
It means that Nginx container is up and running.
Note: The Nginx configuration is stored in the ./infrastructure/nginx/conf.d/default.conf file.
Building Microservices: Using an API Gateway
- When we don't need Nginx api gateway anymore, we can take down container and delete its corresponding volumes (-v) using the down command below:
> docker compose -f docker-compose-api-gw.yml down -v
Kubernetes
First, we need to create a namespace for RPS game microservices and Ingress. To create a rps-app-dev namespace on the K8S cluster, run:
> kubectl apply -f ./k8s/namespaces/rps-app-ns.yml
To check the status, run:
> kubectl get namespaces --show-labels
To create a Simple Fanout Ingress for the RPS microservices, run:
You can select one of the following pre-configured Ingress resources:
a) Without TLS:
> kubectl apply -f ./k8s/ingress/rps-ingress.yml
b) With TLS (server certificate is required, see below):
> kubectl apply -f ./k8s/ingress/rps-tls-ingress.yml
c) With mTLS (server and client certificates are required, see below):
> kubectl apply -f ./k8s/ingress/rps-mtls-ingress.yml
Note: A RPS application Simple Fanout Ingress configuration routes traffic from a single IP address to more than one.

Make sure the RPS application ingress has been created:
> kubectl get ingress -n rps-app-dev
Note: Note for the ingress rule to take effect it needs to be created in the same namespace as the service.
You should see the following output:
      NAME               CLASS   HOSTS                                                                             ADDRESS        PORTS   AGE
      rps-grpc-ingress   nginx   grpc.rps.cmd.internal,grpc.rps.qry.internal,grpc.score.cmd.internal + 1 more...   192.168.49.2   80      12m
      rps-ingress        nginx   rps.internal                                                                      192.168.49.2   80      12m
The first Ingress routes the gRPC API traffic. The second one routes the REST API traffic.
Note the ip address (192.168.49.2) displayed in the output, as you will need this in the next step.
Confirm that the ingress works with the following command:
> kubectl describe ing rps-ingress -n rps-app-dev
You should see the following output:
    Name:             rps-ingress
    Labels:           <none>
    Namespace:        rps-app-dev
    Address:          192.168.49.2
    Ingress Class:    nginx
    Default backend:  <default>
    Rules:
      Host          Path  Backends
      ----          ----  --------
      rps.internal
                    /rps-cmd-api     rps-cmd-service-svc:8080 (10.244.0.76:8080)
                    /rps-qry-api     rps-qry-service-svc:8080 (10.244.0.54:8080)
                    /score-cmd-api   score-cmd-service-svc:8080 (10.244.0.62:8080)
                    /score-qry-api   score-qry-service-svc:8080 (10.244.0.72:8080)
    Annotations:    <none>
    Events:
      Type    Reason  Age                    From                      Message
      ----    ------  ----                   ----                      -------
      Normal  Sync    2m19s (x2 over 2m40s)  nginx-ingress-controller  Scheduled for sync
Repeat the same step for another ingress of rps-grpc-ingress.
Note: All tls ingresses terminate tls at Ingress level. You should see the following lines in the above log:
      TLS:
        rps-tls-secret terminates rps.internal
      and
      TLS:
        rps-cmd-service-grpc-tls-secret terminates grpc.rps.cmd.internal
        rps-qry-service-grpc-tls-secret terminates grpc.rps.qry.internal
        score-cmd-service-grpc-tls-secret terminates grpc.score.cmd.internal
        score-qry-service-grpc-tls-secret terminates grpc.score.qry.internal
10.3 Adding custom entry to the etc/host file for the RPS game microservices (if it does not exist yet )
Add a custom entry to the etc/hosts file using the nano text editor:
> sudo nano /etc/hosts
You should add the following ip address (copied in the previous step) and custom domains to the hosts file:
192.168.49.2 rps.internal grpc.rps.cmd.internal grpc.rps.qry.internal grpc.score.cmd.internal grpc.score.qry.internal
You may check the custom domain name with ping command:
> ping rps.internal
You should see the following output:
      64 bytes from rps.internal (192.168.49.2): icmp_seq=1 ttl=64 time=0.072 ms
      64 bytes from rps.internal (192.168.49.2): icmp_seq=2 ttl=64 time=0.094 ms
      64 bytes from rps.internal (192.168.49.2): icmp_seq=3 ttl=64 time=0.042 ms
Repeat the same step for other custom domain names of grpc.rps.cmd.internal, grpc.rps.qry.internal, _ grpc.score.cmd.internal_, grpc.score.qry.internal.
Monitoring Stack is an open-source Prometheus, Alertmanager and Grafana monitoring infrastructure in Kubernetes.
There are three necessary services in Monitoring Stack setup:
Prometheus endpoint(s) is the application with metrics that we want to track.
Prometheus is a monitoring system and time-series database.
Alertmanager handles alerts sent by Prometheus server.
Grafana is a multi-platform open source analytics and interactive visualization web application that can use Prometheus to create dashboards and graphs.
Monitoring Stack is used to implement the following patterns:
Docker Compose
- Navigate (if it's not already in) to the root directory of the RPS Game project on your computer and run the Docker Compose command below to deploy Prometheus and Grafana on Docker Compose in the background:
> docker compose -f docker-compose-metrics.yml up -d
You should see the following output:
    [+] Running 2/2
     ✔ Container prometheus     Started     0.0s
     ✔ Container grafana        Started     0.0s
- Verify that Prometheus and Grafana containers are up and running by executing the following command:
> docker compose -f docker-compose-metrics.yml ps
You should see the following output:
  NAME                             IMAGE                                     COMMAND                  SERVICE             CREATED              STATUS                          PORTS
  grafana                          grafana/grafana:10.0.1                    "/run.sh"                grafana             About a minute ago   Up About a minute               0.0.0.0:3000->3000/tcp
  prometheus                       prom/prometheus:v2.45.0                   "/bin/prometheus --c…"   prometheus          About a minute ago   Up About a minute               0.0.0.0:9090->9090/tcp
It means that Prometheus and Grafana containers are up and running.
- Navigate to the prometheus endpoint of microservices:
            http://localhost/rps-cmd-api/actuator/prometheus
            http://localhost/rps-qry-api/actuator/prometheus
            http://localhost/score-cmd-api/actuator/prometheus
            http://localhost/score-qry-api/actuator/prometheus
and make sure that all the RPS game microservices are exposing metrics to Prometheus.
- Then, navigate to the target page (Status -> Targets) of the prometheus microservice:
> http://localhost:9090/targets
and make sure that Prometheus is scraping from our microservices properly.

** Status gets refreshed every 5 seconds
Note: The Prometheus configuration file is located at ./infrastructure/metrics/prometheus/prometheus.yml.
- Navigate to the grafana microservice:
> http://localhost:3000
the login window appears. Enter credentials below:
| user name | password |
|---|---|
| admin | admin |
and then navigate to the Dashboards page:
> http://localhost:3000/dashboards
You will see the preconfigured dashboards powered by our prometheus datasorce in the list:

Select any dashboard from the list. You will be redirected to the dashboard main page. Select the application you want to monitor from the Application dropdown list:

Note: The Grafana preconfigured datasources are stored in the ./infrastructure/metrics/grafana/provisioning/datasources folder. The preconfigured Grafana dashboard templates are stored in the ./infrastructure/metrics/grafana/provisioning/dashboards folder. You can find more dashboard templates from Grafana Dashboards website.
- When we don't need Prometheus and Grafana microservices anymore, we can take down containers and delete their corresponding volumes (-v) using the down command below:
> docker compose -f docker-compose-metrics.yml down -v
Kubernetes
To create a kube-monitoring namespace on the k8s cluster, run:
> kubectl apply -f ./k8s/namespaces/kube-monitoring-ns.yml
To check the status, run:
> kubectl get namespaces --show-labels
You should see the following output:
      NAME                   STATUS   AGE     LABELS
      default                Active   10d     kubernetes.io/metadata.name=default
      ingress-nginx          Active   10d     app.kubernetes.io/instance=ingress-nginx,app.kubernetes.io/name=ingress-nginx,kubernetes.io/metadata.name=ingress-nginx
      kube-cache             Active   3d16h   kubernetes.io/metadata.name=kube-cache,name=kube-cache
      kube-db                Active   6d19h   kubernetes.io/metadata.name=kube-db,name=kube-db
      kube-elk               Active   18h     kubernetes.io/metadata.name=kube-elk,name=kube-elk
      kube-monitoring        Active   29m     kubernetes.io/metadata.name=kube-monitoring,name=kube-monitoring
      kube-node-lease        Active   10d     kubernetes.io/metadata.name=kube-node-lease
      kube-nosql-db          Active   26h     kubernetes.io/metadata.name=kube-nosql-db,name=kube-nosql-db
      kube-public            Active   10d     kubernetes.io/metadata.name=kube-public
      kube-system            Active   10d     kubernetes.io/metadata.name=kube-system
      kubernetes-dashboard   Active   10d     addonmanager.kubernetes.io/mode=Reconcile,kubernetes.io/metadata.name=kubernetes-dashboard,kubernetes.io/minikube-addons=dashboard
We used to manually deploy Kubernetes manifest files. Making changes to K8S files as required making the process lengthy and prone to errors as there's no consistency of deployments with this approach. With a fresh Kubernetes cluster, you need to define the namespace, create storage classes, and then deploy your application to the cluster. The process is quite lengthy, and if something goes wrong, it becomes a tedious process to find the problem.
Helm is a package manager for Kubernetes that allows us to easily install and manage applications on Kubernetes clusters.
I am going to use Helm to deploy the Monitoring Stack to the cluster. Monitoring Stack comes with a bunch of standard and third party Kubernetes components. Helm allows you to deploy the Monitoring Stack currently without having strong working knowledge of Kubernetes.
To deploy Monitoring Stack to Kubernetes cluster with helm charts, just run:
> helm install prometheus prometheus-community/kube-prometheus-stack -n kube-monitoring
Wait for some time until the chart is deployed. You should see the following output:
      NAME: prometheus
      LAST DEPLOYED: Sun May 28 12:12:25 2023
      NAMESPACE: kube-monitoring
      STATUS: deployed
      REVISION: 1
      NOTES:
      kube-prometheus-stack has been installed. Check its status by running:
        kubectl --namespace kube-monitoring get pods -l "release=prometheus"

      Visit https://github.com/prometheus-operator/kube-prometheus for instructions on how to create & configure Alertmanager and Prometheus instances using the Operator.
That's it! To check the pod status, run:
> kubectl get all -n kube-monitoring
You should see all installed Monitoring Stack_ components.
To access the Prometheus locally, we have to forward a local port 9090 to the Kubernetes node running Prometheus with the following command:
> kubectl port-forward <prometheus pod name> 9090:9090 -n kube-monitoring
You should see the following output:
      Forwarding from 127.0.0.1:9090 -> 9090
      Forwarding from [::1]:9090 -> 9090
Now you can access the dashboard in the browser on http://localhost:9090.
If you open the grafana service using the following command:
> kubectl get service prometheus-grafana -n kube-monitoring -o yaml
You should see that the default port for Grafana dashboard is 3000:
        ports:
        - name: http-web
          port: 80
          protocol: TCP
          targetPort: 3000
So, we can forward port to host by ingress component and thus gain access to the dashboard by browser.
To create a Simple Single Service Ingress for the Grafana application, run:
> kubectl apply -f ./k8s/ingress/grafana-ingress.yml
Note: A Grafana application Simple Single Service Ingress configuration exposes only one service to external users.
Make sure the Grafana application ingress has been created:
> kubectl get ingress -n kube-monitoring
You should see the following output:
      NAME                    CLASS   HOSTS                    ADDRESS        PORTS   AGE
      grafana-ingress         nginx   grafana.internal         192.168.49.2   80      25s
Note the ip address (192.168.49.2) displayed in the output, as you will need this in the next step.
Add a custom entry to the etc/hosts file using the nano text editor:
> sudo nano /etc/hosts
You should add the following ip address (copied in the previous step) and custom domain to the hosts file:
192.168.49.2 grafana.internal mongodb.internal
You may check the custom domain name with ping command:
> ping grafana.internal
You should see the following output:
      64 bytes from grafana.internal (192.168.49.2): icmp_seq=1 ttl=64 time=0.072 ms
      64 bytes from grafana.internal (192.168.49.2): icmp_seq=2 ttl=64 time=0.094 ms
      64 bytes from grafana.internal (192.168.49.2): icmp_seq=3 ttl=64 time=0.042 ms
Access the Grafana application from any browser by typing:
> grafana.internal
There are several ways we can implement the ELK Stack architecture pattern:
-
Beats —> Elasticsearch —> Kibana
-
Beats —> Logstash —> Elasticsearch —> Kibana
-
Beats —> Kafka —> Logstash —> Elasticsearch —> Kibana
Here we implement the first and second approaches. The last one is the better option for production environment cause Kafka acts as a data buffer and helps prevent data loss or interruption while streaming files quickly.
ELK Stack is used to implement the following patterns:
Docker Compose
- Navigate (if it's not already in) to the root directory of the RPS Game project on your computer and run the Docker Compose command below to deploy Elasticsearch, Logstash and Kibana on Docker Compose in the background:
> docker compose -f docker-compose-elk.yml up -d
You should see the following output:
    [+] Running 4/4
     ✔ Container rps-app-elasticsearch-1              Started     5.9s
     ✔ Container rps-app-kibana-1                     Started     6.9s
     ✔ Container rps-app-logstash-1                   Started     7.0s
     ✔ Container rps-app-filebeat-1                   Started     8.0s
- Verify that Elasticsearch, Logstash, Filebeat and Kibana containers are up and running by executing the following command:
> docker compose -f docker-compose-elk.yml ps
You should see the following output:
  NAME                             IMAGE                                     COMMAND                  SERVICE             CREATED             STATUS                  PORTS
  rps-app-elasticsearch-1          elastic/elasticsearch:6.8.23              "/usr/local/bin/dock…"   elasticsearch       3 hours ago         Up Less than a second   0.0.0.0:9200->9200/tcp, 0.0.0.0:9300->9300/tcp
  rps-app-filebeat-1               elastic/filebeat:6.8.23                   "/usr/local/bin/dock…"   filebeat            3 hours ago         Up 3 hours
  rps-app-kibana-1                 elastic/kibana:6.8.23                     "/usr/local/bin/kiba…"   kibana              3 hours ago         Up About a minute       0.0.0.0:5601->5601/tcp
  rps-app-logstash-1               elastic/logstash:6.8.23                   "/usr/local/bin/dock…"   logstash            3 hours ago         Up 3 hours              0.0.0.0:5044->5044/tcp, 0.0.0.0:9600->9600/tcp, 0.0.0.0:50000->50000/tcp, 0.0.0.0:50000->50000/udp
It means that Elasticsearch, Logstash, Filebeat and Kibana containers are up and running.
- Navigate to the kibana microservice:
> http://localhost:5601
Note: When attempting to access Kibana while it’s starting, a message saying that Kibana is not ready yet will be displayed in the browser. Give it a minute or two and then you are good to go.
When using Kibana, you will need to add the index "rps-app-%{+YYYY.MM.dd}" we created earlier in logstash config file ./infrastructure/elk/logstash/pipeline/logstash.conf to get the information:
    elasticsearch {
      hosts => "http://host.docker.internal:9200"
      index => "rps-app-%{+YYYY.MM.dd}"
      user => "${LOGSTASH_INTERNAL_USER}"
      password => "${LOGSTASH_INTERNAL_PASSWORD}"
    }
To do this, access the Kibana and on the left hand side menu, click the Discover menu item.

Kibana uses index patterns for retrieving data from Elasticsearch. So, to get started, you must create an index pattern. In this page, you should see an index that has been created by Logstash. To create a pattern for matching this index, enter rps-app-* and then click the Next button.

Then pick a field for filtering the data by time. Choose @timestamp field from the Time Filter field name drop-down list and click the Create Index Pattern button.

The rps-app-* index pattern will be created.

Click again the Discover menu item and the log events related to the RPS Game application will be shown:

Note: The Elasticsearch configuration is stored in the ./infrastructure/elk/elasticsearch/config/elasticsearch.yml file.
The Logstash configuration is stored in the ./infrastructure/elk/logstash folder.
The Filebeat configuration is stored in the ./infrastructure/elk/filebeat/filebeat.yml file.
Note: The Filebeat collects logs only from containers ending with "-service". It can be changed in the ./infrastructure/elk/filebeat/filebeat.yml file.
        - condition:
            contains:
              docker.container.image: "-service" # collect logs from containers ending with "-service"
There are currently six official Beats from Elastic: Beats Family
The Kibana configuration is stored in the ./infrastructure/elk/kibana/config/kibana.yml file.
Running Elasticsearch on Docker
Running Kibana on Docker
Kibana Tutorials
Getting started with the Elastic Stack and Docker-Compose
- When we don't need Elasticsearch, Logstash and Kibana backing microservices anymore, we can take down containers and delete their corresponding volumes (-v) using the down command below:
> docker compose -f docker-compose-elk.yml down -v
Kubernetes
To create a kube-elk namespace on the K8S cluster, run:
> kubectl apply -f ./k8s/namespaces/kube-elk-ns.yml
Note: In Kubernetes, namespaces provides a mechanism for isolating groups of resources within a single cluster. However not all objects are in a namespace.
To check the status, run:
> kubectl get namespaces --show-labels
You should see the following output:
      NAME                   STATUS   AGE     LABELS
      default                Active   2d13h   kubernetes.io/metadata.name=default
      ingress-nginx          Active   2d13h   app.kubernetes.io/instance=ingress-nginx,app.kubernetes.io/name=ingress-nginx,kubernetes.io/metadata.name=ingress-nginx
      kube-elk               Active   2d12h   kubernetes.io/metadata.name=kube-elk,name=kube-elk
      kube-node-lease        Active   2d13h   kubernetes.io/metadata.name=kube-node-lease
      kube-public            Active   2d13h   kubernetes.io/metadata.name=kube-public
      kube-system            Active   2d13h   kubernetes.io/metadata.name=kube-system
      kubernetes-dashboard   Active   2d13h   addonmanager.kubernetes.io/mode=Reconcile,kubernetes.io/metadata.name=kubernetes-dashboard,kubernetes.io/minikube-addons=dashboard
Elasticsearch is the core component of ELK. It works as a searchable database for log files.
To deploy elasticsearch cluster to Kubernetes, first run:
> kubectl apply -f ./k8s/rbacs/elasticsearch-rbac.yml
Then deploy a headless service for Elasticsearch pods using the following command:
> kubectl apply -f ./k8s/services/elasticsearch-svc.yml
Note: You cannot directly access the application running in the pod. If you want to access the application, you need a Service object in the Kubernetes cluster.
Headless service means that only internal pods can communicate with each other. They are not exposed to external requests outside the Kubernetes cluster. Headless services should be used when client applications or pods want to communicate with specific (not randomly selected) pod (stateful application scenarios).
And then run:
> kubectl apply -f ./k8s/sets/elasticsearch-statefulset.yml
To monitor the deployment status, run:
> kubectl rollout status sts/elasticsearch-sts -n kube-elk
To check the pod status, run:
> kubectl get pods -n kube-elk
You should see the following output:
      NAME                                   READY   STATUS    RESTARTS         AGE
      elasticsearch-sts-0                    1/1     Running   0                16m
      elasticsearch-sts-1                    1/1     Running   0                15m
      elasticsearch-sts-2                    1/1     Running   0                15m
To access the Elasticsearch locally, we have to forward a local port 9200 to the Kubernetes node running Elasticsearch with the following command:
> kubectl port-forward <elasticsearch pod> 9200:9200 -n kube-elk
In our case:
> kubectl port-forward elasticsearch-sts-0 9200:9200 -n kube-elk
You should see the following output:
      Forwarding from 127.0.0.1:9200 -> 9200
      Forwarding from [::1]:9200 -> 9200
The command forwards the connection and keeps it open. Leave the terminal window running and proceed to the next step.
In another terminal tab, test the connection with the following command:
> curl localhost:9200
The output prints the deployment information.
Alternatively, access localhost:9200 from the browser. The output shows the cluster details in JSON format, indicating the deployment is successful.
You may also check the health of your Elasticsearch cluster with this command:
> curl localhost:9200/_cluster/health?pretty
You should see the following output:
    {
      "cluster_name" : "k8s-logs",
      "status" : "green",
      "timed_out" : false,
      "number_of_nodes" : 1,
      "number_of_data_nodes" : 1,
      "active_primary_shards" : 0,
      "active_shards" : 0,
      "relocating_shards" : 0,
      "initializing_shards" : 0,
      "unassigned_shards" : 0,
      "delayed_unassigned_shards" : 0,
      "number_of_pending_tasks" : 0,
      "number_of_in_flight_fetch" : 0,
      "task_max_waiting_in_queue_millis" : 0,
      "active_shards_percent_as_number" : 100.0
    }
You may also check the state of your Elasticsearch cluster with this command:
> curl localhost:9200/_cluster/state?pretty
You may also check the log of your Elasticsearch cluster pod with this command:
> kubectl logs <pod name> -n kube-elk
Or container inside your Elasticsearch cluster pod with this command:
> kubectl logs <pod name> -c <container name> -n kube-elk
Filebeat is used to farm all the logs from all our nodes and pushing them to Elasticsearch.
To deploy Filebeat to Kubernetes, first run:
> kubectl apply -f ./k8s/rbacs/filebeat-rbac.yml
Then run:
> kubectl apply -f ./k8s/configmaps/filebeat-configmap.yml
Note: If you are running the Beats —> Elasticsearch —> Kibana scenario, go to the filebeat-configmap.yml file and make the changes below before deploying:
    # Send events directly to Elasticsearch cluster
    output.elasticsearch:
     hosts: ['${FILEBEAT_ELASTICSEARCH_URL:elasticsearch-svc.kube-elk}']
     username: ${FILEBEAT_ELASTICSEARCH_USERNAME}
     password: ${FILEBEAT_ELASTICSEARCH_PASSWORD}

    # Send events to Logstash
    # output.logstash:
    #  hosts: ['${FILEBEAT_LOGSTASH_URL:logstash-svc.kube-elk}']
And then run:
> kubectl apply -f ./k8s/sets/filebeat-daemonset.yml
Verify that the Filebeat DaemonSet rolled out successfully using kubectl:
> kubectl get ds -n kube-elk
You should see the following status output:
      NAME           DESIRED   CURRENT   READY   UP-TO-DATE   AVAILABLE   NODE SELECTOR   AGE
      filebeat-dst   1         1         1       1            1           <none>          135m
To verify that Elasticsearch is indeed receiving this data, query the Filebeat index with this command:
> curl http://localhost:9200/filebeat-*/_search?pretty
You can also make sure that filebeat container is up and running by viewing logs:
> kubectl logs <filebeat pod name> -c filebeat -n kube-elk -f
Logstash is used for ingesting data from a multitude of sources, transforming it, and then sending it to Elasticsearch.
Note: Skip this step if you are running the Beats —> Elasticsearch —> Kibana scenario.
To deploy Logstash to Kubernetes, first run:
> kubectl apply -f ./k8s/services/logstash-svc.yml
Then run:
> kubectl apply -f ./k8s/configmaps/logstash-configmap.yml
And then run:
> kubectl apply -f ./k8s/deployments/logstash-deployment.yml
To check the status, run:
> kubectl get deployment/logstash-deployment -n kube-elk
You should see the following output:
      NAME                  READY   UP-TO-DATE   AVAILABLE   AGE
      logstash-deployment   1/1     1            1           26m
Make sure that logstash container is up and running by viewing pod's logstash container logs:
> kubectl logs <logstash pod name> -c logstash -n kube-elk -f
Logstash also provides monitoring APIs for retrieving runtime metrics about Logstash. By default, the monitoring API attempts to bind to port tcp:9600. So, to access the Logstash monitoring API, we have to forward a local port 9600 to the Kubernetes node running Logstash with the following command:
> kubectl port-forward <logstash pod name> 9600:9600 -n kube-elk
You should see the following output:
      Forwarding from 127.0.0.1:9600 -> 9600
      Forwarding from [::1]:9600 -> 9600
Now You can use the root resource to retrieve general information about the Logstash instance, including the host and version with the following command:
> curl localhost:9600/?pretty
You should see the following output:
      {
        "host" : "logstash",
        "version" : "6.8.23",
        "http_address" : "0.0.0.0:9600",
        "id" : "5db8766c-2737-47cc-80c6-26c3621604ec",
        "name" : "logstash",
        "build_date" : "2022-01-06T20:30:42Z",
        "build_sha" : "2d726680d98e4e6dfb093ff1a39cc1c0bf1d1ef5",
        "build_snapshot" : false
      }
Kibana is a visualization tool. It uses a web browser interface to organize and display data.
To deploy Kibana to Kubernetes, first run:
> kubectl apply -f ./k8s/configmaps/kibana-configmap.yml
Then run:
> kubectl apply -f ./k8s/services/kibana-svc.yml
And then run:
> kubectl apply -f ./k8s/deployments/kibana-deployment.yml
To access the Kibana interface, we have to forward a local port 5601 to the Kubernetes node running Kibana with the following command:
> kubectl port-forward <kibana pod> 5601:5601 -n kube-elk
The command forwards the connection and keeps it open. Leave the terminal window running and proceed to the next step.
To check the state of the deployment, in another terminal tab, perform the following request against the Elasticsearch REST API:
> curl localhost:9200/_cat/indices?v
Note: If you are running a single node cluster (Docker Desktop or MiniKube) you might need to perform the following request against the Elasticsearch REST API::
     > curl --location --request PUT 'localhost:9200/_settings' \
       --header 'Content-Type: application/json' \
       --data '{
           "index": {
               "number_of_replicas": 0
           }
       }'
You should see the following output:
      health status index                      uuid                   pri rep docs.count docs.deleted store.size pri.store.size
      green  open   .kibana                    fP_HM1riQWGKpkl8FuGFTA   1   0          2            0     10.4kb         10.4kb
      green  open   .kibana_1                  g2SMz8XjShmSzTwmOQu9Fw   1   0          0            0       261b           261b
      green  open   .kibana_2                  2Poc2zmRRwawJNBO8Xeamg   1   0          0            0       261b           261b
      green  open   .kibana_task_manager       RgTFfA6lQ_CoSVUW8NbZGQ   1   0          2            0     19.2kb         19.2kb
      green  open   logstash-2023.05.27        sNFgElHBTbSbapgYPYk9Cw   5   0     132000            0     28.6mb         28.6mb
Note: If you are running the Beats —> Logstash —> Elasticsearch —> Kibana scenario.
      health status index                      uuid                   pri rep docs.count docs.deleted store.size pri.store.size
      green  open   .kibana                    fP_HM1riQWGKpkl8FuGFTA   1   0          2            0     10.4kb         10.4kb
      green  open   .kibana_1                  g2SMz8XjShmSzTwmOQu9Fw   1   0          0            0       261b           261b
      green  open   .kibana_2                  2Poc2zmRRwawJNBO8Xeamg   1   0          0            0       261b           261b
      green  open   .kibana_task_manager       RgTFfA6lQ_CoSVUW8NbZGQ   1   0          2            0     19.2kb         19.2kb
      green  open   filebeat-6.8.23-2023.05.20 EUSLOZMWQGSyWMrh2EJiRA   5   0     122481            0     34.2mb         34.2mb
Note: If you are running the Beats —> Elasticsearch —> Kibana scenario.
And then access the Kibana UI in any browser:
> http://localhost:5601
In Kibana, navigate to the Management -> Kibana Index Patterns. Kibana should display the Filebeat index.
Enter "logstash-*" or "filebeat-*" (depending on running ELK pattern) as the index pattern, and in the next step select @timestamp as your Time Filter field.
Navigate to the Kibana dashboard and in the Discovery page, in the search bar enter:
> kubernetes.pod_name:<name of the pod>
You should see a list of log entries for the specified pod.
Elasticsearch cron job is used for clearing Elasticsearch indices.
To deploy Elasticsearch cron job to Kubernetes, first run:
> kubectl apply -f ./k8s/configmaps/curator-configmap.yml
And then run:
> kubectl apply -f ./k8s/cronjobs/curator-cronjob.yml
Verify that the Elasticsearch cron job rolled out successfully using kubectl:
> kubectl get cronjobs -n kube-elk
You should see the following status output:
      NAME              SCHEDULE    SUSPEND   ACTIVE   LAST SCHEDULE   AGE
      curator-cronjob   0 0 1 * *   False     0        <none>          22m
Docker Compose
13.1 Deploying Health Monitoring backing microservice and Adminer database management tool on Docker Compose
- Navigate (if it's not already in) to the root directory of the RPS Game project on your computer and run the Docker Compose command below to deploy Health Monitoring and Adminer on Docker Compose in the background:
> docker compose -f docker-compose-misc.yml up -d
Note: Health Monitoring backing microservice and Adminer database management tool are not necessary but can be useful.
You should see the following output:
    [+] Running 2/2
     ✔ Container adminer                    Started     5.9s
     ✔ Container webstatus                  Started     6.9s
- Verify that Health Monitoring and Adminer containers are up and running by executing the following command:
> docker compose -f docker-compose-misc.yml ps
You should see the following output:
  NAME                   IMAGE                                     COMMAND                  SERVICE             CREATED             STATUS                  PORTS
  adminer                adminer:4.8.1                             "entrypoint.sh php -…"   adminer             About a minute ago  Up About a minute       0.0.0.0:19080->8080/tcp
  webstatus              rps-app-webstatus                         "dotnet WebStatus.dll"   webstatus           About a minute ago  Up About a minute       80/tcp, 0.0.0.0:15000->5000/tcp
It means that Health Monitoring and Adminer containers are up and running.
- Navigate to the webstatus microservice:
> http://localhost:5000/status/hc-ui
and make sure that all the RPS game microservices are up and running.

** Status gets refreshed every 10 seconds
- When we don't need Health Monitoring backing microservice and Adminer database management tool anymore, we can take down containers and delete their corresponding volumes (-v) using the down command below:
> docker compose -f docker-compose-misc.yml down -v
Local Machine
* Once the infrastructure ([backing services](https://12factor.net/backing-services)) is deployed, you can build and run microservices.
Each microservice has multiple profiles:
| profile name | is default | purpose |
|---|---|---|
| dev | Yes | Development on local machine |
| docker | No | Deployment on Docker Compose |
| it | No | Running integration tests |
| prod | No | Deployment on Kubernetes cluster |
- Execute the mvn clean install command in the root directory of the project to build microservices and its dependencies for running on local machine.
> mvn clean install
Note: Each microservice and shared dependency should normally be hosted in its own git repository.
- Run the microservices by executing the following commands:
      > java -jar ./microservices/rps-cmd-service/target/rps-cmd-service.jar
      > java -jar ./microservices/rps-qry-service/target/rps-qry-service.jar
      > java -jar ./microservices/score-cmd-service/target/score-cmd-service.jar
      > java -jar ./microservices/score-qry-service/target/score-qry-service.jar
- Open any browser and navigate to a microservice Open API 3.0 definition (REST API).
      http://localhost:8081/rps-cmd-api/swagger-ui/index.html
      http://localhost:8082/rps-qry-api/swagger-ui/index.html
      http://localhost:8083/score-cmd-api/swagger-ui/index.html
      http://localhost:8084/score-qry-api/swagger-ui/index.html
Docker Compose
* Open any browser and navigate to a microservice Open API 3.0 definition (REST API).
            http://localhost/rps-cmd-api/swagger-ui/index.html
            http://localhost/rps-qry-api/swagger-ui/index.html
            http://localhost/score-cmd-api/swagger-ui/index.html
            http://localhost/score-qry-api/swagger-ui/index.html
Note: NGINX is used as API gateway so if you deploy the microservices on docker containers you should remove port number from the url.
Local Machine && Docker Desktop
* Click on the __Authorize__ button on the microservice Open API 3.0 definition page:

which opens a pop-up window below:

- Click on the Authorize button on the pop-up window, which redirects you to the Keycloak server login page:

- Enter credentials to get appropriate access to the REST API endpoints and click on the Sign In button. You will be redirected back to the Open API 3.0 definition page. You should see the authentication success pop-up window.

- Click the Close button to close the pop-up window.
Available realm test users with corresponding roles:
| user name | password | roles |
|---|---|---|
| admin | admin | ROLE_ADMIN, ROLE_USER |
| test | test | ROLE_USER |
Note: Don't confuse admin super user with realm admin test user.
Available test realm roles:
| role | description |
|---|---|
| ROLE_ADMIN | view all games, find any game by id, delete any game by id, delete any score by id |
| ROLE_USER | play a game, view all games played by the user, view all scores of the games played by the user |
Notes: Spring security manages endpoint access control om microservice level.
SecurityConfig and GrpcSecurityConfig configuration files configure microservice endpoints access control based on Keycloak realm users and roles.
From experience, Docker Compose is a great option for small-scale applications that don't require a lot of infrastructure. It's easy to use and can be deployed quickly. It also a great tool for local development.
However, Docker Compose is not as scalable as Kubernetes and is not that suitable for developing large-scale applications. Kubernetes is a more complex but more powerful deployment technique.
Docker Compose vs K8S, pros and cons:
Docker Swarm vs Kubernetes: how to choose a container orchestration tool Kubernetes vs Docker: A comprehensive comparison
Generating self-signed server and client certificates with OpenSSL
Generate a public CA key and certificate with the following command:
> openssl req -x509 -sha256 -newkey rsa:4096 -days 3560 -nodes -keyout rps-public-ca.key -out rps-public-ca.crt -subj '/CN=RPS Public Cert Authority/O=RPS Public CA'
Note: Skip the next steps if you are not going to use TLS connection for development environment.
Generate a self-signed server certificate for the rps.internal host with the following command:
> openssl req -new -nodes -newkey rsa:4096 -out rps.internal.csr -keyout rps.internal.key -subj '/CN=rps.internal/O=rps.internal'
Sign in the generated SSL server certificate with public CA certificate by executing the following command:
> openssl x509 -req -sha256 -days 365 -in rps.internal.csr -CA rps-public-ca.crt -CAkey rps-public-ca.key -set_serial 01 -out rps.internal.crt
You should see the following output:
    Certificate request self-signature ok
    subject=CN = rps.internal, O = rps.internal
At this point, we have a signed server certificate rps.internal.crt and key rps.internal.key which needs to be defined to the Kubernetes cluster through a Kubernetes secret resource. The following command will create a secret named rps-tls-secret that holds the server certificate and the private key:
> kubectl create secret tls rps-tls-secret --key rps.internal.key --cert rps.internal.crt -n rps-app-dev
You should see the following output:
secret/rps-tls-secret created
It means that the secret has successfully been created. This secret is used to validate the server's identity. To view secrets execute the following command:
> kubectl get secrets -n rps-app-dev
You should see the following output:
      NAME                       TYPE                DATA   AGE
      rps-tls-secret             kubernetes.io/tls   2      19s
Note: The rps-tls-secret secret is of type kubernetes.io/tls.
If you deploy rps-tls-ingress Ingress instead of the rps-ingress one and execute the following command:
> curl -k -v https://rps.internal
Note: -k flag is used to skip self-signed certificate verification, -v flag is used to get verbose fetching.
You should see the following output:
      *   Trying 192.168.49.2:443...
      * Connected to rps.internal (192.168.49.2) port 443 (#0)
      * ALPN, offering h2
      * ALPN, offering http/1.1
      * TLSv1.0 (OUT), TLS header, Certificate Status (22):
      * TLSv1.3 (OUT), TLS handshake, Client hello (1):
      * TLSv1.2 (IN), TLS header, Certificate Status (22):
      * TLSv1.3 (IN), TLS handshake, Server hello (2):
      * TLSv1.2 (IN), TLS header, Finished (20):
      * TLSv1.2 (IN), TLS header, Supplemental data (23):
      * TLSv1.3 (IN), TLS handshake, Encrypted Extensions (8):
      * TLSv1.2 (IN), TLS header, Supplemental data (23):
      * TLSv1.3 (IN), TLS handshake, Certificate (11):
      * TLSv1.2 (IN), TLS header, Supplemental data (23):
      * TLSv1.3 (IN), TLS handshake, CERT verify (15):
      * TLSv1.2 (IN), TLS header, Supplemental data (23):
      * TLSv1.3 (IN), TLS handshake, Finished (20):
      * TLSv1.2 (OUT), TLS header, Finished (20):
      * TLSv1.3 (OUT), TLS change cipher, Change cipher spec (1):
      * TLSv1.2 (OUT), TLS header, Supplemental data (23):
      * TLSv1.3 (OUT), TLS handshake, Finished (20):
      * SSL connection using TLSv1.3 / TLS_AES_256_GCM_SHA384
      * ALPN, server accepted to use h2
      * Server certificate:
      *  subject: CN=rps.internal
      *  start date: Jun  4 20:13:01 2023 GMT
      *  expire date: Jun  1 20:13:01 2033 GMT
      *  issuer: CN=rps.internal
      *  SSL certificate verify result: self-signed certificate (18), continuing anyway.
You can see that self-signed server certificate has successfully been verified.
Repeat the same steps for 4 grpc server certificates. Make sure to change custom domain to a corresponding gprc one:
      -subj '/CN=rps.internal/O=rps.internal'
      to
      -subj '/CN=grpc.rps.cmd.internal/O=grpc.rps.cmd.internal'
      -subj '/CN=grpc.rps.qry.internal/O=grpc.rps.qry.internal'
      -subj '/CN=grpc.score.cmd.internal/O=grpc.score.cmd.internal'
      -subj '/CN=grpc.score.qry.internal/O=grpc.score.qry.internal'
Note: Skip the next steps if you are not going to use mTLS connection for dev environment.
Generate CA "Certificate Authority" certificate and key with the following command:
> openssl req -x509 -sha256 -newkey rsa:4096 -keyout ca.key -out ca.crt -days 356 -nodes -subj '/CN=RPS Cert Authority'
Then apply the CA as secret to kubernetes cluster with the following command:
> kubectl create secret generic ca-secret --from-file=ca.crt=ca.crt -n rps-app-dev
You should see the following output:
secret/ca-secret created
It means that the secret has successfully been created. This secret is used to validate client certificates. Validating the (mTLS) connection.
Next we generate a client Certificate Signing Request (CSR) and client key with the following command:
> openssl req -new -newkey rsa:4096 -keyout rps.client.key -out rps.client.csr -nodes -subj '/CN=RPS Client'
Then we sign in the Certificate Signing Request (CSR) with the CA certificate by executing the following command:
> openssl x509 -req -sha256 -days 365 -in rps.client.csr -CA ca.crt -CAkey ca.key -set_serial 02 -out rps.client.crt
You should see the following output:
      Certificate request self-signature ok
      subject=CN = RPS Client
It means that the client certificate and key have successfully been generated.
Verifying mTLS connection:
First, try to curl without client certificate:
> curl -vk https://rps.internal
You should see the following output:
      <html>
      <head><title>400 No required SSL certificate was sent</title></head>
      <body>
      <center><h1>400 Bad Request</h1></center>
      <center>No required SSL certificate was sent</center>
      <hr><center>nginx</center>
      </body>
      </html>
Then try the same call with client key and cert:
> curl -vk https://rps.internal --key rps.client.key --cert rps.client.crt
It should do the trick this time. Make sure you can see the following lines in the log:
      * TLSv1.3 (IN), TLS handshake, CERT verify (15):
      ...
      * TLSv1.3 (OUT), TLS handshake, CERT verify (15):
As you can see the certificate verification has been made twice, one for server certificate and another one for the client certificate.
TLS Using multiple SSL certificates in HTTPS load balancing with Ingress
For testing gRPC API (make sure that you are using correct grpc port for a profile), please consider the following options:
- BloomRPC GUI client for gRPC
- gRPCurl command-line tool
- gRPC UI command-line tool
- Test gRPC services with Postman or gRPCurl in ASP.NET Core
For testing REST API, you can also consider the following options:
For testing MongoDB, you can also consider the following options:
To get an idea of HTTP/2 performance, you can follow the link below:
Windows
Kubernetes
- K8S Cluster-level Logging Architecture
- K8S Dashboard
- K8S Ingress Installation Guide
- K8S Overview for MariaDB Users
- K8S Monitoring Stack Configuration
ELK
Keycloak
- Configuring Keycloak
- Authorizing multi-language microservices with oauth2-proxy
- Keycloak REST API v18.0
- JWT (JSON Web Token) Inspection
MongoDB
- Domain Driven Design (DDD)
- Command Query Responsibility Segregation (CQRS)
- CQRS
- Event sourcing (ES)
- Event Sourcing
- API Gateway
- Gateway routing
- Gateway offloading
- Gateway Aggregation
- Database per service
- Index Table
- Sharding
- Polyglot persistence
- Bounded context
- Domain event
- Service instance per container
- Health Check API
- Application metrics
- Messaging
- Idempotent consumer
- Server side discovery
- Log aggregation
- Publisher-Subscriber
- Sidecar
- External Configuration Store
- Federated Identity
- Cache-Aside
- Bulkhead
- Asynchronous Request-Reply
- Competing Consumers
- Leader Election
- Launch the BloomRPC application.
- Add path to proto folder of the rps-grpc-lib project to BloomRPC paths:

- Add testing service definition proto file:

- Add gRPC server url and port:

- Query the gRPC service:

- Download Apache Bench tool on your computer.
- Launch CLI and type ab -n 1000 -c 10 http://:/contect path and endpoint/ to benchmark microservice.
> ab -n 1000 -c 10 http://127.0.0.1:8083/score-qry-api/v1/scores
-n 1000 is the number of requests to perform for the benchmarking session. The default is to just perform a single request which usually leads to non-representative benchmarking results. -c 10 is the concurrency and denotes the number of multiple requests to perform at a time. Default is one request at a time.