Debugging Using The Apex Rollup Logger
When addressing issues experienced while using Rollup, the included logger (which comes installed by default, under the Rollup Plugin Custom Metadata Type - the record labeled Apex Debug Rollup Logger) can be extremely helpful to diagnose issues.
In order to Debug within Apex, you can either:
- open up the Salesforce Developer Console (click the gear icon on the upper right of your screen and select "Developer Console"
- OR activate a trace for your user in the "Debug Logs" section of Setup
Either way, you'll want to have your Apex debugging level (either on the default trace present whenever the Developer Console is open, or on the trace you've setup for your user) conform to whichever value you select in the Rollup Logging Debug Levels section, below.
In order to activate Rollup Logging, first navigate to the Rollup Control Custom Metadata Type:
- Navigate to Setup and search for Custom Metadata Types (CMDT) - click on the link that comes up
- Click on "Manage Records" next to the Rollup Control CMDT and select the "Org Defaults" record
- Ensure the "Is Rollup Logging Enabled" checkbox is enabled
Then, navigate to the Rollup Plugin CMDT:
- Return to the Custom Metadata Type menu in setup
- Click on "Manage Records" next to the Rollup Plugin CMDT
- Validate that the record labeled
Apex Debug Rollup Loggerexists (if the record was not deleted post-installation manually, you're done - otherwise, continue to the next steps) - if it does not, click "New" and set up a new record - the label is not important, but the
Org DefaultsRollup Control record should be selected, and the name of the record has to beRollupLogger - Return to the Custom Metadata Type menu and click "Manage Records" next to the Rollup Plugin Parameter CMDT
- Click "New" and set up a new record - the label should be "Logging Debug Level", the name of the record should be
LoggingDebugLevel, the Rollup Plugin should be set to the record you just created in the step above, and the Value field should be set to the desired debug level (more on this in a below)
Whether you've just set up rollup logging for the first time, or are looking to customize the logging level employed by the default logger, let's review the Value field for the LoggingDebugLevel Rollup Plugin Parameter linked to the RollupLogger Rollup Plugin CMDT. The Value field here conforms to the System.LoggingLevel enum in Apex:
- ERROR
- WARN
- INFO
- DEBUG (this is the most commonly used logging level, and what the vast majority of logging messages generated by Apex Rollup employ)
- FINE
- FINER
- FINEST
Note that these logging levels are ranked; ERROR is highest-priority message, and FINEST is the lowest. Also note that INFO is currently unused within apex-rollup. If your trace logging level and LoggingDebugLevel Rollup Plugin Parameter record are set to DEBUG, for example, you will see and be able to review all rollup log messages set to ERROR, WARN, and DEBUG (and you would see INFO messages; there just aren't any of those at the moment).
The easiest way to view the created log messages is to use the Log pane in the Salesforce Developer Console:

Logs will get generated if you:
- update a record where Apex Rollup is set to run from either a RT-flow or from within Apex
- debug a Flow that involves rollups
- run a unit test that involves updating a record with rollups configured
Double click on a log item to view it and make sure you check off the Debug Only option (also highlighted in the above screenshot). You can also choose to download the raw log; if you do that, you can search for each log entry in the file associated with Apex Rollup by using |Rollup: as your search string. Note the vertical bar that starts that search string!
Since the debug logs are broken up into a variety of different sections, you may find yourself scrolling through the entirety of the log the first few times you view Apex Rollup logs. I use the logs extensively to debug issues myself, and the more time you spend reading them, the more informative they become as far as pinpointing issues. In particular, things that are frequently interesting to see are the log items that start with the text Rollup: lookup record prior to rolling up: and Rollup: lookup record after rolling up: (if your logging level is set to FINE or lower, you'll also get a log entry between those two if the parent record has been deemed eligible to get updated which reads Rollup: updating record ....
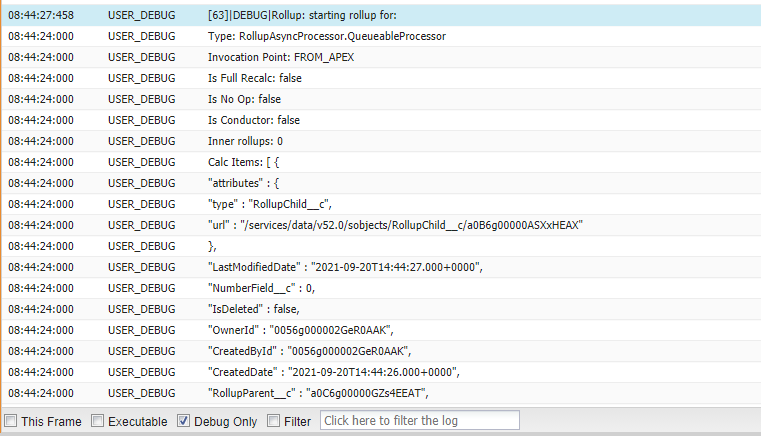
As you become familiar with traversing the different sections of the generated logs, identifying potential problems becomes a lot easier. I always like to ensure my Rollups are set up correctly by reviewing the log entries that start Rollup: starting rollup for:, for example:
FINE
- used when a no-op rollup is encountered
- used when a parent record is being updated
- used in a batch full recalc when checking cached items between batches
- used in Rollup Logger when reporting which logging plugins are being retrieved
- used at the end of an entire rollup operation when reporting which records have been updated
FINER
- used exclusively within the
RollupEvaluatorclass to print out whether or not a match has occurred for any given calculation item based on exclusion rules like theCalc Item Where Clausethat you can configure
FINEST
- used exclusively within the
RollupEvaluatorclass to report theCalc Item Where Clausethat has been supplied